
1. Moving The Markets
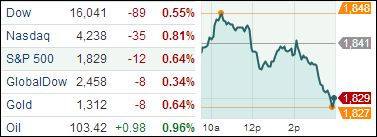
The ‘Fed Minutes’ were perhaps the biggest headline and market mover today. Recent economic data has been disappointing, particularly in the job and housing markets, which has raised questions about the Fed’s future tapering plans. Some of the sluggishness appears to be due to the snowy weather across the country, but despite a weak December jobs report, the Fed’s 10 voting members unanimously decided to reduce the central bank’s bond-buying program to $65 billion in February, down from $75 billion in January. Fed officials said that as long the economic outlook doesn’t change, the Fed will likely reduce its purchases by $10 billion at each meeting. Markets moved accordingly in negative fashion.
Although the broader market was down, some prominent stocks moved higher including Zales (ZLC) which surged about 40% after Signet Jewelers (SIG) unveiled a deal to acquire the Dallas-based jewelry retailer for $21 a share. Tesla (TSLA) said it sold a record number of its Model S sedans in the Q4 2013, and that it expects to deliver even more this year. The company’s shares gained in accordance after the closing bell.
The dollar rose following the release of the minutes from the Fed; gold prices fell for a second straight day and the CBOE Volatility index, often referred to as Wall Street’s fear gauge, rose 11.75 percent. The emerging markets focus remained on rising unrest in both Ukraine and Thailand. Ukraine’s sovereign bonds and currency both tumbled as a renewed wave of violence hit the capital Kiev, adding pressure on Russia’s rouble, which hit an all-time low against the euro.
Our 10 ETFs in the Spotlight slipped a bit with the indexes, but 3 of them still remain in the green for the year.
2. ETFs in the Spotlight
In case you missed the announcement and description of this section, you can read it here again.
It features 10 broadly diversified ETFs from my HighVolume list as posted every Monday. Furthermore, they are screened for the lowest MaxDD% number meaning they have been showing better resistance to temporary sell offs than all others over the past year.
In other words, none of them ever triggered their 7.5% sell stop level during this time period, which included a variety of severe market pullbacks but no move into outright bear market territory.
Here are the 10 candidates:
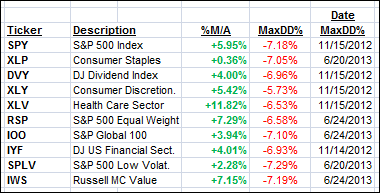
All of them are in “buy” mode meaning their prices are above their respective long term trend lines by the percentage indicated (%M/A).
Year to date, here’s how the above candidates have fared so far:
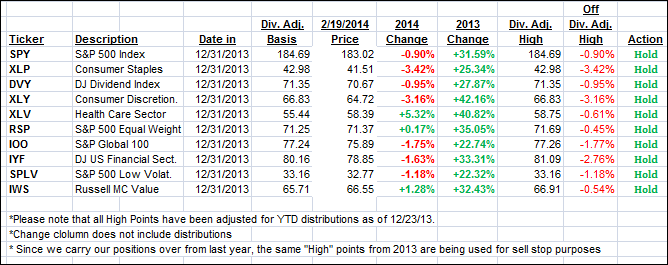
To be clear, the first table above shows the position of the various ETFs in relation to their respective long term trend lines (%M/A), while the second one tracks their trailing sell stops in the “Off High” column.
3. Domestic Trend Tracking Indexes (TTIs)
Our Trend Tracking Indexes (TTIs) corrected slightly but are firmly entrenched on the bullish side of their respective trend lines:
Domestic TTI: +3.41% (last close +3.83%)
International TTI: +5.87% (last close +6.37%)
Disclosure: I am obliged to inform you that I, as well as advisory clients of mine, own some of these listed ETFs. Furthermore, they do not represent a specific investment recommendation for you, they merely show which ETFs from the universe I track are falling within the guidelines specified.
Contact Ulli