
1. Moving The Markets
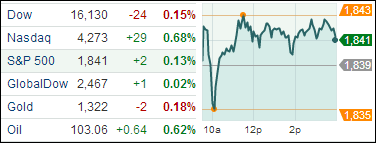
Stocks edged a bit higher today. The Dow lagged the other leading indexes, weighed down by Coca-Cola (KO) after reporting weak Q4 results; the Nasdaq, however, rose to 13-year highs amid an eighth straight session gain, which it has not experienced since July 2013.
Tesla Motors Inc (TSLA) hit an all-time high following a report Apple’s M&A chief met Tesla CEO Elon Musk last year, sparking speculation Apple (AAPL) could be interested in buying the electric car maker. Forest Laboratories (FRX) was the biggest gainer on the S&P 500 after Actavis (ACT) said it would acquire the specialty pharmaceuticals company in a cash and stock deal valued at about $25 billion.
As the bitter winter cold continues to bear down on the east coast of the U.S., natural gas and crude oil futures are performing accordingly. A new winter storm named Rex has moved through the U.S. Midwest and on Tuesday was hitting the Northeast, bringing strong winds and fresh snow, according to the latest forecast by the Weather Channel. Crude oil and natural gas futures settled higher today with crude oil for March delivery (CLH4) rising 2.1% and natural gas for March delivery (NGH14) gaining 6.5%.
Global markets also edged higher today following a fresh round of stimulus from the Bank of Japan. The Bank of Japan maintained its expansionary monetary policy by extending special loan programs to help support economic growth. All-in-all it was a good day for the markets, and I look forward to seeing what tomorrow brings.
Our 10 ETFs in the Spotlight inched higher, with XLV sprinting, and 3 of them are now in the green for the year.
2. ETFs in the Spotlight
In case you missed the announcement and description of this section, you can read it here again.
It features 10 broadly diversified ETFs from my HighVolume list as posted every Monday. Furthermore, they are screened for the lowest MaxDD% number meaning they have been showing better resistance to temporary sell offs than all others over the past year.
In other words, none of them ever triggered their 7.5% sell stop level during this time period, which included a variety of severe market pullbacks but no move into outright bear market territory.
Here are the 10 candidates:
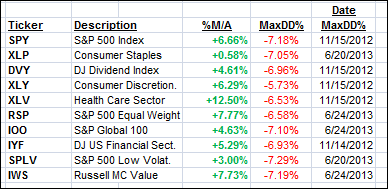
All of them are in “buy” mode meaning their prices are above their respective long term trend lines by the percentage indicated (%M/A).
Year to date, here’s how the above candidates have fared so far:
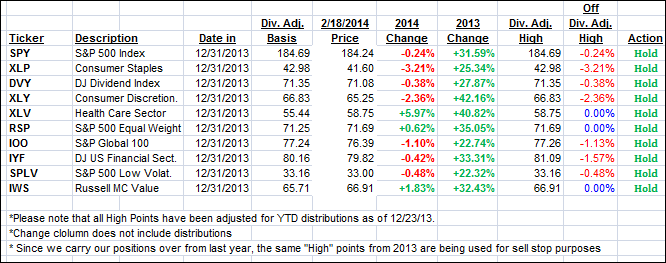
To be clear, the first table above shows the position of the various ETFs in relation to their respective long term trend lines (%M/A), while the second one tracks their trailing sell stops in the “Off High” column.
3. Domestic Trend Tracking Indexes (TTIs)
Our Trend Tracking Indexes (TTIs) followd upward momentum and headed deeper into bullish territory.
Domestic TTI: +3.83% (last close +3.58%)
International TTI: +6.37% (last close +5.65%)
Disclosure: I am obliged to inform you that I, as well as advisory clients of mine, own some of these listed ETFs. Furthermore, they do not represent a specific investment recommendation for you, they merely show which ETFs from the universe I track are falling within the guidelines specified.
Contact Ulli