
1. Moving The Markets
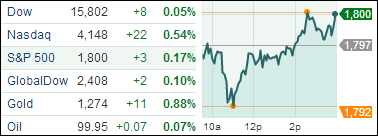
A new report on U.S. manufacturing growth was released today that showed the sector barely expanded in January. This was not a good start for trading in February and the Dow Jones Industrial Average (DJI) felt the wrath falling by more than 2% on the day. If you read the last piece I wrote at the end of January, then you may remember us discussing the common saying “as January goes, so goes the year.” Well, the saying rang true as ever today as the Nasdaq and S&P 500 also dropped more than 2%.
Throughout the month of January traders were jittery about the health of both the U.S. and developing country economies. This did not bode well for retailers because of their sensitivity to consumer confidence, so we saw big names like Amazon (AMZN), Home Depot (HD) and Best Buy (BBY) get hammered. As nervous as investors are these days, it would not come as a surprise to see continued volatility in this sector for the near future.
To follow suit, auto manufacturers released some consistently underperforming data for January sales. Ford (F), GM (GM and Toyota (TM) all posed sales declines to start the new year. Chrysler, however, reported sales that topped analysts’ forecasts. So, it wasn’t all red for all companies today. We did see some big gainers, such as Herbalife (HLF) whose shares rose more than 7% when the company said 2013 Q4 earnings would beat forecasts and that it would raise its planned stock buyback by another $500 million.
Our 10 ETFs in the Spotlight headed south, one trailing sell stop was triggered while 3 of them have now crossed their respective long-term trend lines to the downside. Take a look:
2. ETFs in the Spotlight
In case you missed the announcement and description of this section, you can read it here again.
It features 10 broadly diversified ETFs from my HighVolume list as posted every Monday. Furthermore, they are screened for the lowest MaxDD% number meaning they have been showing better resistance to temporary sell offs than all others over the past year.
In other words, none of them ever triggered their 7.5% sell stop level during this time period, which included a variety of severe market pullbacks but no move into outright bear market territory.
Here are the 10 candidates:
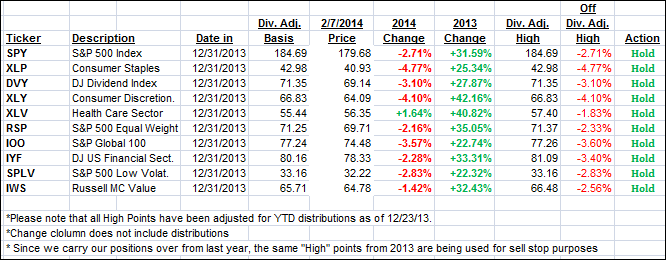
7 of them remain in “buy” mode meaning their prices are above their respective long term trend lines by the percentage indicated (%M/A).
As I wrote last week, we sold our holdings in XLP and today, before the markets accelerated to the downside, I liquidated our XLY holdings as well. XLY still hovers above its trend line by a meager +0.26%, but its trailing sell stop got taken out today.
Year to date, here’s how the above candidates have fared so far:

3. Domestic Trend Tracking Indexes (TTIs)
Our Trend Tracking Indexes (TTIs) joined the ups and downs of the past week, but they remain on the bullish side of their respective trend lines:
Domestic TTI: +1.15% (last close +2.36%)
International TTI: +1.36% (last close +3.37%)
These are the numbers to watch. Once the Domestic TTI breaks below its line, and stays there, a new bear market will have arrived. Plan accordingly.
Contact Ulli
Comments 2
Ulli 2/4/14
Thanks for your reply on the “sale” of XLP of 1/30/14. However, I still have a question. I understand when to sell per your instructions. I sold my XLP the next day.
But, I do not see a sell in any of your charts? Also, I think your 2 charts above are duplicated by mistake- there is no maxDD% (2/3/14)
Keep up the great work!!!
Rudy
Rudy,
Yes, there is always that chance of me making a mistake….
Ulli…