
1. Moving The Markets
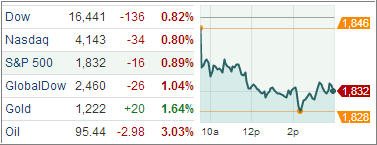
U.S. stock indexes posted their largest decline in three weeks on the first trading day of 2014, after the benchmark S&P 500 finished its best year since 1997. Oil and gas producers were among the hardest hit following a 3% drop in oil prices to under $96 a barrel as Libya prepares to reopen a major oilfield. The dollar rallied though against a basket of major currencies (DXY) as U.S. jobs, housing and manufacturing data gave support to the Federal Reserve’s decision to start slowing its stimulus program this month. This was the dollar’s largest daily gain in five months against a basket of currencies.
Across the pond, the euro fell 0.7 percent against the dollar to $1.3654, touching a two-week low of $1.3628. It might be hard to believe, but Europe’s common currency was the strongest-performing major currency in 2013. Historically though, the euro has tended to weaken at the start of a calendar year.
Perhaps the most positive news as we begin 2014 is that U.S. factory activity remained at a 2-1/2-year high in December and the number of Americans filing new claims for jobless benefits fell again last week, suggesting the world’s largest economy is on stable footing.
Checking in on gold- and precious-metals and mining funds during a gold-bullish kickoff to the New Year, SPDR Gold Trust (GLD) and iShares Silver Trust (SLV) are gaining 1.8% and 3.2%, respectively. Market Vectors Gold Miners ETF (GDX) is ahead by 3.6%.
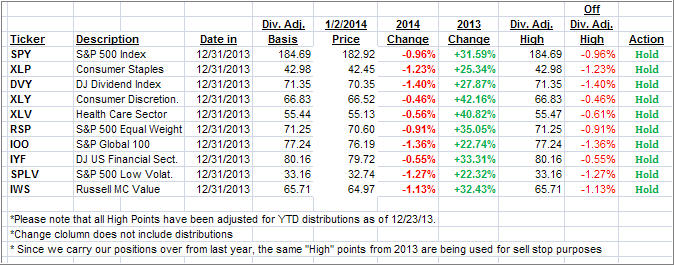
With the major indexes pulling back today, our 10 ETFs in the Spotlight followed suit as they all came off their recent highs to varying degrees. Take a look at the YTD table below.
2. ETFs in the Spotlight
In case you missed the announcement and description of this section, you can read it here again.
It features 10 broadly diversified ETFs from my HighVolume list as posted every Monday. Furthermore, they are screened for the lowest MaxDD% number meaning they have been showing better resistance to temporary sell offs than all others over the past year.
In other words, none of them ever triggered their 7.5% sell stop level during this time period, which included a variety of severe market pullbacks but no move into outright bear market territory.
Here are the 10 candidates:
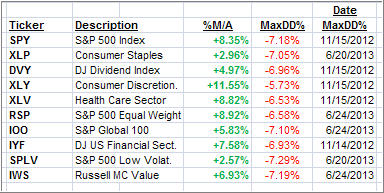
All of them are in “buy” mode meaning their prices are above their respective long term trend lines by the percentage indicated (%M/A).
Now let’s look at the MaxDD% column and review the ETF with the lowest drawdown as an example. As you can see, that would be XLY with the lowest MaxDD% number of -5.73%, which occurred on 11/15/2012.
The sell off in the month of June 2013 did not affect XLY at all as its “worst” MaxDD% of -5.73% still stands since the November 2012 sell off.
A quick glance at the last column showing the date of occurrences confirms that five of these ETFs had their worst drawdown in November 2012, while the other five were affected by the June 2013 swoon, however, none of them dipped below their -7.5% sell stop.
Year to date, here’s how the above candidates have fared so far:
3. Domestic Trend Tracking Indexes (TTIs)
Our Trend Tracking Indexes (TTIs) pulled back as well but remain above their long term trend lines by the following percentages:
Domestic TTI: +4.34% (last close +4.79%)
International TTI: +6.60% (last close +7.49%)
Contact Ulli