
1. Moving The Markets
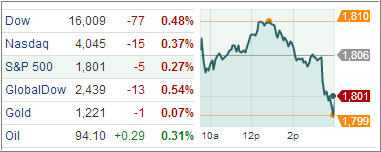
Shoppers spent less over the Thanksgiving weekend and that weighed on stocks Monday. While they turned out in record numbers in the four days ending Sunday they plunked down less cash than they did last year. It was the first decline in Thanksgiving weekend spending since a retail trade group began tracking it in 2006. Investors reacted by selling all types of retailer stocks, from department stores to specialty chains. J.C. Penney, Target and Coach fell more than 1 percent each. Urban Outfitters dropped 3.5 percent.
The dollar is up against its major competitors at the start of the new trading week. The U.S. currency recovered from early weakness Monday and has extended its gains following the unexpected increase in the ISM manufacturing index. There will be a number of important U.S. economic reports released later this week, including GDP on Thursday and the U.S. jobs report for November on Friday.
All ETF sectors, except for Energy and Health Care, closed in the red zone Monday. Already reeling from some sour November performances, precious metals mining ETFs have started the last month of the year in similar fashion to how they ended the previous month: Ugly.
A rocky 2013 for emerging markets exchange traded funds in terms of investor redemptions continued in November and looks to do the same in December, with diversified funds tracking developing world economies witnessing $3.6 billion of outflows last month. Of the 10 worst ETFs in terms of 2013 outflows, five are emerging markets funds, including FXI and the iShares MSCI Brazil Capped ETF (EWZ), according to BlackRock data.
Our ETFs in the Spotlight pulled slightly off their highs, so let’s take a look:
2. ETFs in the Spotlight
In case you missed the announcement and description of this section, you can read it here again.
It features 10 broadly diversified ETFs from my HighVolume list as posted every Monday. Furthermore, they are screened for the lowest MaxDD% number meaning they have been showing better resistance to temporary sell offs than all others over the past year.
In other words, none of them ever triggered their 7.5% sell stop level during this time period, which included a variety of severe market pullbacks but no move into outright bear market territory.
Here are the 10 candidates:
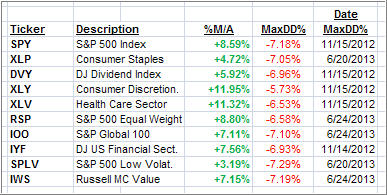
All of them are in “buy” mode meaning their prices are above their respective long term trend lines by the percentage indicated (%M/A).
Now let’s look at the MaxDD% column and review the ETF with the lowest drawdown as an example. As you can see, that would be XLY with the lowest MaxDD% number of -5.73%, which occurred on 11/15/2012.
The recent sell off in the month of June did not affect XLY at all as its “worst” MaxDD% of -5.73% still stands since the November 2012 sell off.
A quick glance at the last column showing the date of occurrences confirms that five of these ETFs had their worst drawdown in November 2012, while the other five were affected by the June 2013 swoon, however, none of them dipped below their -7.5% sell stop.
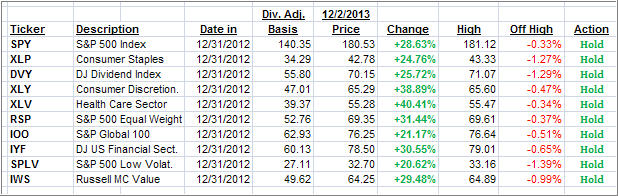
Year to date, here’s how the above candidates have fared so far:
3. Domestic Trend Tracking Indexes (TTIs)
Trend wise, our Trend Tracking Indexes (TTIs) slipped with the indexes but remain above their long term trend lines by the following percentages:
Domestic TTI: +4.49% (last close +5.07%)
International TTI: +7.17% (last close +7.93%)
Disclosure: I am obliged to inform you that I, as well as advisory clients of mine, own some of these listed ETFs. Furthermore, they do not represent a specific investment recommendation for you, they merely show which ETFs from the universe I track are falling within the guidelines specified.
Contact Ulli