
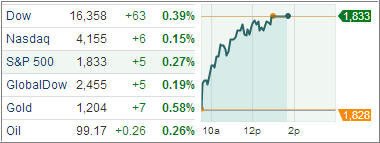
1. Moving The Markets
The Christmas rally continued today with the Dow and S&P 500 eking out another record close during this Holiday-shortened session caused by a positive durable goods orders report. Big ticket items (aircraft and transportation equipment) rose 3.5% vs. an expected 2%.
Home prices gained 8.2% in October from the same month last year, while they edged up 0.5% from September. Surprisingly, so far rising mortgage rates have not yet put a lid on single-family home sales.
Historically, December has been a good month for stocks and, so far, this year appears to be no exception. With traders now having received some clarity from the Fed in regards to tapering, we may see this current momentum carry into next year. Of course, there are always unintended consequences, which could spoil the best made plans. That is why we have our trailing sell stops indentified and ready to be executed should the need arise.
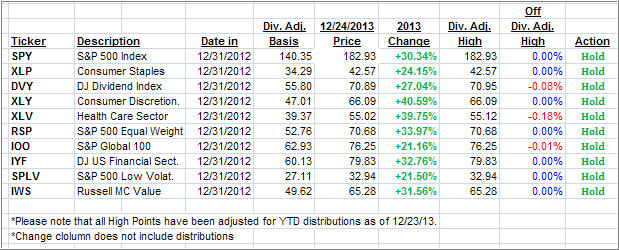
To no surprise, seven out of our ten ETFs in the Spotlight made new highs today; the other three are very close as the second table below shows.
2. ETFs in the Spotlight
In case you missed the announcement and description of this section, you can read it here again.
It features 10 broadly diversified ETFs from my HighVolume list as posted every Monday. Furthermore, they are screened for the lowest MaxDD% number meaning they have been showing better resistance to temporary sell offs than all others over the past year.
In other words, none of them ever triggered their 7.5% sell stop level during this time period, which included a variety of severe market pullbacks but no move into outright bear market territory.
Here are the 10 candidates:
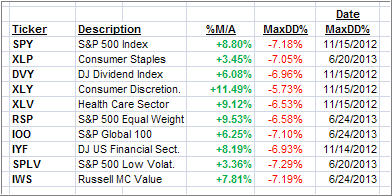
All of them are in “buy” mode meaning their prices are above their respective long term trend lines by the percentage indicated (%M/A).
Now let’s look at the MaxDD% column and review the ETF with the lowest drawdown as an example. As you can see, that would be XLY with the lowest MaxDD% number of -5.73%, which occurred on 11/15/2012.
The recent sell off in the month of June did not affect XLY at all as its “worst” MaxDD% of -5.73% still stands since the November 2012 sell off.
A quick glance at the last column showing the date of occurrences confirms that five of these ETFs had their worst drawdown in November 2012, while the other five were affected by the June 2013 swoon, however, none of them dipped below their -7.5% sell stop.
Year to date, here’s how the above candidates have fared so far:
3. Domestic Trend Tracking Indexes (TTIs)
Looking at the big picture, our Trend Tracking Indexes (TTIs) continue to advance with the overall positive tone in the market and remain above their long term trend lines by the following percentages:
Domestic TTI: +4.54% (last close +4.52%)
International TTI: +6.57% (last close +6.57%)
Contact Ulli