
1. Moving The Markets
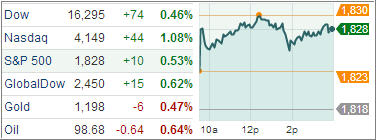
U.S. stocks climbed on Monday, with the Dow industrials and S&P 500 again closing at records, as Apple and Facebook led a rally in the technology sector and after data showed consumer sentiment at a five-month high and spending up in November. Facebook jumped as the social-networking site’s first day of trading as one of the S&P 500 companies. Shares of Apple gained after it reached a deal to sell its iPhones through China Mobile, the biggest phone company on the globe.
The dollar lost ground against the currencies of major U.S. trading partners while the yield on the 10-year Treasury note used in figuring mortgage rates and other consumer loans rose 4 basis points to 2.93 percent.
This month WisdomTree is back with its latest launch of The WisdomTree Bloomberg U.S. Dollar Bullish Fund (USDU), which seeks to provide exposure to the U.S. dollar against a broad basket of developed and emerging market currencies. The timing of this launch seems to be perfect, given that Fed will eventually begin its taper program in early 2014.
The Fed’s decision has finally revived hopes for the U.S. dollar. Investors who had unwound their long positions in the dollar after a prior No Taper from the Fed are considering adding long positions now. Although the dollar lost ground today, it is expected to rise going into the New Year against major currencies.
Eight out of our ten ETFs in the Spotlight made new highs today; the other two are hovering within striking distance.
2. ETFs in the Spotlight
In case you missed the announcement and description of this section, you can read it here again.
It features 10 broadly diversified ETFs from my HighVolume list as posted every Monday. Furthermore, they are screened for the lowest MaxDD% number meaning they have been showing better resistance to temporary sell offs than all others over the past year.
In other words, none of them ever triggered their 7.5% sell stop level during this time period, which included a variety of severe market pullbacks but no move into outright bear market territory.
Here are the 10 candidates:
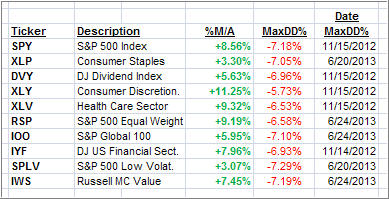
All of them are in “buy” mode meaning their prices are above their respective long term trend lines by the percentage indicated (%M/A).
Now let’s look at the MaxDD% column and review the ETF with the lowest drawdown as an example. As you can see, that would be XLY with the lowest MaxDD% number of -5.73%, which occurred on 11/15/2012.
The recent sell off in the month of June did not affect XLY at all as its “worst” MaxDD% of -5.73% still stands since the November 2012 sell off.
A quick glance at the last column showing the date of occurrences confirms that five of these ETFs had their worst drawdown in November 2012, while the other five were affected by the June 2013 swoon, however, none of them dipped below their -7.5% sell stop.
Year to date, here’s how the above candidates have fared so far:

3. Domestic Trend Tracking Indexes (TTIs)
Looking at the big picture, our Trend Tracking Indexes (TTIs) continue to advance with the overall positive tone in the market and remain above their long term trend lines by the following percentages:
Domestic TTI: +4.52% (last close +4.31%)
International TTI: +6.57% (last close +5.95%)
Contact Ulli