
1. Moving The Markets
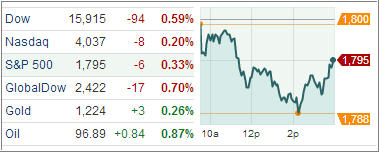
U.S. stocks fell for a third straight session, dropping from record levels in a broad decline as investors took profits amid signs of a weak holiday shopping season. Retail and consumer discretionary stocks were among the weakest of the day. Amazon.com Inc slipped 2 percent to $384.66 and was one of the biggest drags on the S&P 500. Some investors might simply be locking in profits after eight weeks of gains, while others might be fearful of the Fed beginning to taper the stream of cash it’s pumping into the economy.
On a more global scale, the yen advanced against the dollar and the euro on Tuesday, reversing losses sustained earlier in the global trading day, as falling stock markets worldwide sent traders into the relative safety of the Japanese currency. This was perhaps a factor in Japan’s Nikkei share average rising to its highest close in six years today. Brazil’s economy contracted in the third quarter for the first time since early 2009 as a steep drop in investment showed flagging confidence in what was recently one of the world’s most attractive emerging markets.
Mortgage REIT ETFs are gaining focus on renewed taper concerns. The declining delinquency rates coupled with an increasing credit balance in turn enhances credit quality of the firms, making the conditions ideal for investing in the mortgage finance industry. Further, stable job markets, rising home sales, higher home prices and still-low mortgage interest rates are compelling homeowners to finance more loans.
Our ETFs in the Spotlight continued to slip off their highs but remain in bullish territory:
2. ETFs in the Spotlight
In case you missed the announcement and description of this section, you can read it here again.
It features 10 broadly diversified ETFs from my HighVolume list as posted every Monday. Furthermore, they are screened for the lowest MaxDD% number meaning they have been showing better resistance to temporary sell offs than all others over the past year.
In other words, none of them ever triggered their 7.5% sell stop level during this time period, which included a variety of severe market pullbacks but no move into outright bear market territory.
Here are the 10 candidates:
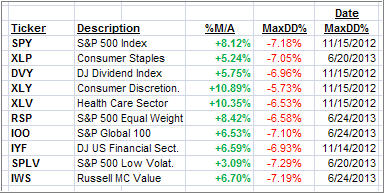
All of them are in “buy” mode meaning their prices are above their respective long term trend lines by the percentage indicated (%M/A).
Now let’s look at the MaxDD% column and review the ETF with the lowest drawdown as an example. As you can see, that would be XLY with the lowest MaxDD% number of -5.73%, which occurred on 11/15/2012.
The recent sell off in the month of June did not affect XLY at all as its “worst” MaxDD% of -5.73% still stands since the November 2012 sell off.
A quick glance at the last column showing the date of occurrences confirms that five of these ETFs had their worst drawdown in November 2012, while the other five were affected by the June 2013 swoon, however, none of them dipped below their -7.5% sell stop.
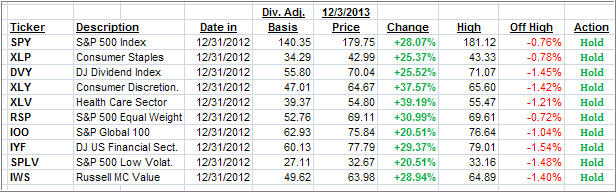
Year to date, here’s how the above candidates have fared so far:
3. Domestic Trend Tracking Indexes (TTIs)
Trend wise, our Trend Tracking Indexes (TTIs) followed market direction but remain above their long term trend lines by the following percentages:
Domestic TTI: +4.42% (last close +4.49%)
International TTI: +6.42% (last close +7.17%)
Disclosure: I am obliged to inform you that I, as well as advisory clients of mine, own some of these listed ETFs. Furthermore, they do not represent a specific investment recommendation for you, they merely show which ETFs from the universe I track are falling within the guidelines specified.
Contact Ulli