
1. Moving The Markets
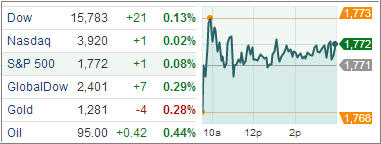
The Dow Jones has exceeded expectations once again as it rose to another all-time high today. It seems investors are “hanging 10” on the wave of momentum that the surprisingly strong U.S. jobs report created last Friday. This is a hard pill to swallow as we near year-end, because all-time highs like this often make investors skeptical to put more money into stocks, yet at the same time it is so hard to walk away from returns like we have seen in 2013. However, we are still in Bull Market territory.
In the ETF world today, the Healthcare and Energy sectors were the top performers, showing gains of 0.24% and 0.18% respectively.
With all the tweets about Twitter’s IPO last week and given the volatility inherent to software IPOs, one might be hesitant to invest directly in the company. However, investors that do not want to take the risk of investing in a single company such as Twitter will have another option for owning the social media stock this week.
At least a couple of ETFs are set to add TWTR to their portfolio in the next five days, creating a new avenue for investors to own a piece of the company: Global X Social Media ETF(NASDAQ: SOCL), Renaissance IPO ETF (NYSE: IPO) and First Trust IPOX 100 Index ETF (NYSE: FPX) will most likely all pick up the stock, but I am curious to see who adds it to their portfolio first.
Here are the ETFs in the spotlight:
2. ETFs in the Spotlight
In case you missed the announcement and description of this section, you can read it here again.
It features 10 broadly diversified ETFs from my HighVolume list as posted every Monday. Furthermore, they are screened for the lowest MaxDD% number meaning they have been showing better resistance to temporary sell offs than all others over the past year.
In other words, all of them never triggered their 7.5% sell stop level during this time period, which included a variety of severe market pullbacks but no move into outright bear market territory.
Here are the 10 candidates:
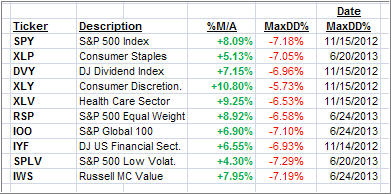
All of them are in “buy” mode meaning their prices are above their respective long term trend lines by the percentage indicated (%M/A).
Now let’s look at the MaxDD% column and review the ETF with the lowest drawdown as an example. As you can see, that would be XLY with the lowest MaxDD% number of -5.73%, which occurred on 11/15/2012.
The recent sell off in the month of June did not affect XLY at all as its “worst” MaxDD% of -5.73% still stands since the November 2012 sell off.
A quick glance at the last column showing the date of occurrences confirms that five of these ETFs had their worst drawdown in November 2012, while the other five were affected by the June 2013 swoon, however, none of them dipped below their -7.5% sell stop.
Year to date, here’s how the above candidates have fared so far:
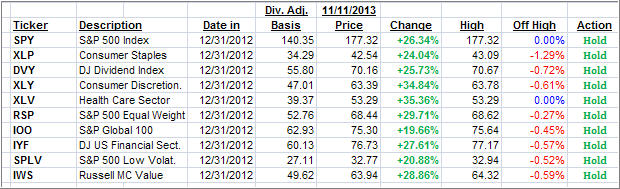
Both, SPY and XLV, made new highs for the year as the “Off High” column shows. All others have come off their highs by the percentages shown.
3. Domestic Trend Tracking Indexes (TTIs)
Trend wise, our Trend Tracking Indexes (TTIs) inched up and remain above their long term trend lines by the following percentages:
Domestic TTI: +4.00% (Friday +3.98%)
International TTI: +6.73% (Friday +6.48%)
Disclosure: I am obliged to inform you that I, as well as advisory clients of mine, own some of these listed ETFs. Furthermore, they do not represent a specific investment recommendation for you, they merely show which ETFs from the universe I track are falling within the guidelines specified.
Contact Ulli