
1. Moving The Markets
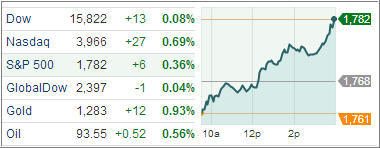
Both the S&P 500 and the Dow Jones industrial average have been hitting a series of record highs this year (1,782 even and 15,821.63, respectively) as the economy allegedly improves, the Federal Reserve keeps up its bond-buying program and as U.S. companies report higher earnings. All represent feel good signs as we head toward the holiday season. Some relate the impressive performance of the market today to the news of Janet Yellen taking over as the head of the Federal Reserve.
In China news, Communist Party leaders in Beijing pledged to promote market forces in the country’s state-dominated economy after the four-day meeting wrapped up late Tuesday. But in a disappointment for reform advocates, they failed to announce dramatic changes such as curbing the dominance of state industry, extending property rights to farmers or relaxing the one child birth control policy.
Rumors of a new ETF were confirmed today as State Street Global Advisors announced it is planning to launch a “floating rate treasuries ETF” that will list on the NYSE and trade under the FLTY. It will be based on an index that aims to track the market for floating rate notes of the United States Treasury.
Here are our ETFs in the spotlight:
2. ETFs in the Spotlight
In case you missed the announcement and description of this section, you can read it here again.
It features 10 broadly diversified ETFs from my HighVolume list as posted every Monday. Furthermore, they are screened for the lowest MaxDD% number meaning they have been showing better resistance to temporary sell offs than all others over the past year.
In other words, all of them never triggered their 7.5% sell stop level during this time period, which included a variety of severe market pullbacks but no move into outright bear market territory.
Here are the 10 candidates:
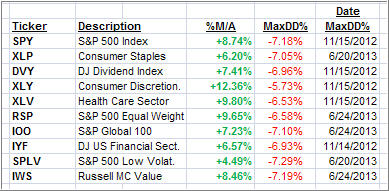
All of them are in “buy” mode meaning their prices are above their respective long term trend lines by the percentage indicated (%M/A).
Now let’s look at the MaxDD% column and review the ETF with the lowest drawdown as an example. As you can see, that would be XLY with the lowest MaxDD% number of -5.73%, which occurred on 11/15/2012.
The recent sell off in the month of June did not affect XLY at all as its “worst” MaxDD% of -5.73% still stands since the November 2012 sell off.
A quick glance at the last column showing the date of occurrences confirms that five of these ETFs had their worst drawdown in November 2012, while the other five were affected by the June 2013 swoon, however, none of them dipped below their -7.5% sell stop.
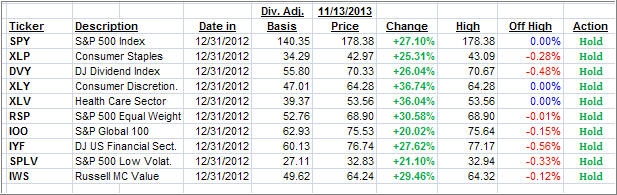
Year to date, here’s how the above candidates have fared so far:
3. Domestic Trend Tracking Indexes (TTIs)
Our Trend Tracking Indexes (TTIs) recovered from yesterday’s pullback and remain above their long term trend lines by the following percentages:
Domestic TTI: +4.43% (yesterday +3.86%)
International TTI: +6.97% (yesterday +6.57%)
Disclosure: I am obliged to inform you that I, as well as advisory clients of mine, own some of these listed ETFs. Furthermore, they do not represent a specific investment recommendation for you, they merely show which ETFs from the universe I track are falling within the guidelines specified.
Contact Ulli