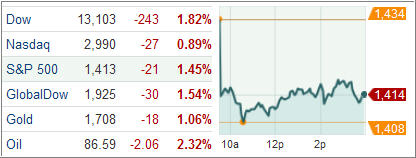
Stocks took another plunge today with the Dow Industrials hitting a seven-week low after a batch of weak US earnings numbers and worries over Spain deepened investors concern of a global slowdown.
Risk sentiment soured after ratings agency Moody’s Investor service downgraded Spain’s five regions by one or two notches stating their long term funding alternatives remained uncertain while cash reserves were limited.
After a 262-point fall, the Dow Jones Industrial Average (DJIA) closed 243 points lower, posting its biggest daily drop since June 21. Breadth within the Dow turned negative with all but two of the blue-chip index’s 30 stocks finishing lower.
The S&P 500 Index (SPX) gave back 21 points, the lowest since Sep. 5 with commodities and financials pacing the losses and all of its 10 business groups finishing lower for the day.
Treasury yields turned lower as prices moved up after institutional investors, including insurance companies and pension funds, gobbled up safe haven assets at the auction of government’s two-year notes.
The benchmark 10-year Treasury yield fell six basis points to 1.76 percent while 30-year Treasury bond yields dropped seven basis points to 2.90 percent, the lowest since Oct 15.
Meanwhile, the US dollar advanced Tuesday as risky bets remained off the table on downbeat corporate earnings report and downgrading of five Spanish regions by Moody’s. The ICE dollar index, a gauge of the greenback’s worth against a basket of six currencies, rose to 79.922 from late Monday’s 79.653.
European stocks retreated Tuesday with disappointing third quarter results from companies on both side of the Atlantic weighing on investors. The Stoxx Europe 600 index fell 1.7 percent with UK’s Mulberry Group Plc crashing 24 percent after the luxury handbag maker warned of lower profits owing to more challenging environment in Asia.
Mining firms were also trading lower with Norwegian aluminum producer Norsk Hydro slipping 5.2 percent while BHP Billiton Plc and Rio Tinto Plc lost 2.4 percent and 1.9 percent, respectively.
The Spanish IBEX 35 index dropped 1.6 percent after the country’s central bank said Q3 GDP shrank 0.4 percent over the previous quarter.
The French CAC 40 index tripped 2.2 percent after drug-maker Sanofi SA fell 3.2 percent while oil major Total SA lost 2.25 percent. Tire maker Michelin however, bucked the trend, gaining 3.4 percent after third quarter revenue jumped 5.7 percent.
The German DAX 30 index slipped 2.1 percent after chemical maker BASF SE tanked 4 percent following Du Pont’s poor results. Industrial group Siemens AG lost 1.4 percent.
Resource firms tumbled in London, dragging the FTSE 100 index lower. Basic metals, gold and oil producers all sank, driving the London index lower 1.4 percent. Chip designer ARM Plc however bucked the trend, surging 7.7 percent as it posted double-digit gains in sales and profits.
In the ETF space, materials-related funds were hit the hardest as investors grew wary of demand over the weak economic recovery. The United States Oil Fund (USO) was one of the biggest decliners, losing 2.83 percent after December futures dropped to $86.17 a barrel, the lowest since mid-July.
The State Street Materials Select Sector SPDR (XLB), which includes companies from chemicals, metals and mining and paper and packaging industries, tumbled 3.01 percent after its second biggest holding Du Pont crashed 9.06 percent on weak earnings result.
Our Trend Tracking Indexes (TTIs) headed south as well, but stayed on the bullish side closing the day as follows:
Domestic TTI: +1.22%
International TTI: +2.94%
So, how much of an air pocket remains under the current index levels? If you can believe Goldman Sachs, their year-end S&P 500 target is still at 1,250. Hmm, that means another 12% from current levels, which would get the index to just about a break even point—if their forecast is right.
Be that as it may, this is the time for you to revisit your sell stop levels again to make sure you know what to execute should the bears gain the upper hand.
Disclosure: No holdings in ETFs discussed above
Contact Ulli

Comments 2
A few days ago, I wrote here the market was going sideways, which, for an options trader means using spreads (or waiting longer to see what is going to happen, with the market trend). Well, now, to me, the market has become bearish, whether this is a correction or a move to a more permanent bear market. Now, for me as an options trader, this means buying puts (or, once again, waiting longer to see what is going to happen, with the market trend). I’m a trend trader, and I generally use the crossing of 10 SMA and 30 SMA as a signal to me as to whether the market is bullish or bearish. On October 18, the 10 SMA and the 30 SMA crossed. I usually wait a few days to make sure this is not a fake-out and, of course, always look at other indicators, but I have found the 10 and 30 day SMA to be pretty accurate about whether the market is bullish or bearish.
I should have added this comment, earlier, to my previous one. I have not seen how this market has stayed bullish as long as it has, but I try to follow trends, rather than second-guess what the market will do. There are enough second-guessers, out there, on blogs and television interviews. But no one can argue with what the market actually is doing, the market’s trend.