
- Moving the markets
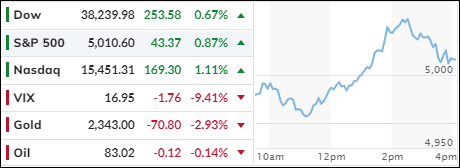
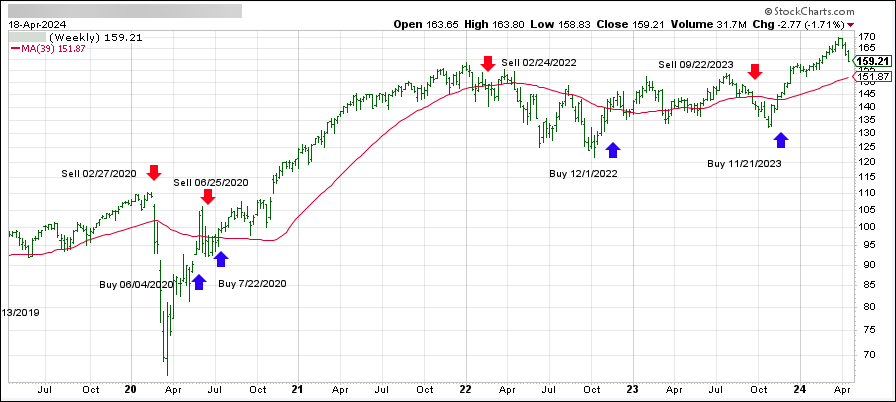
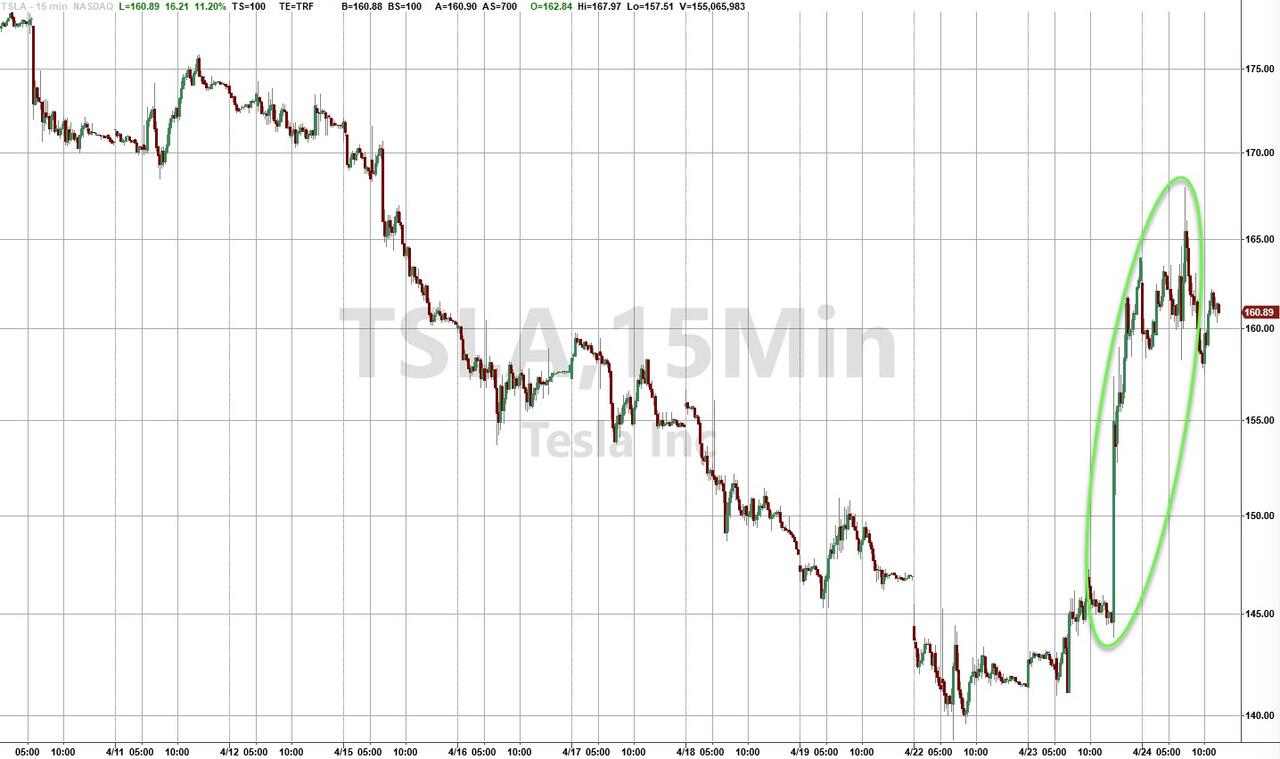
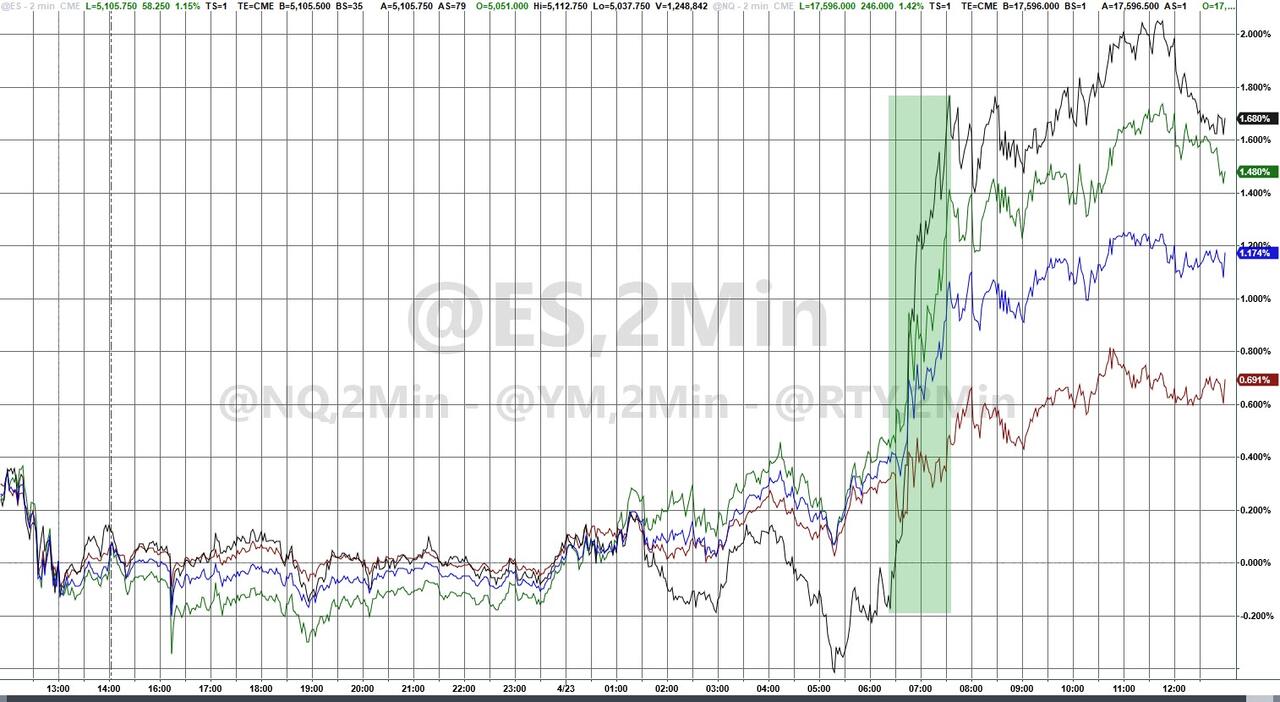
In today’s trading session, the Nasdaq experienced a burst of energy at the open, thanks to Tesla’s post-earnings jump, which propelled the tech-centric index upward. This surge was sparked by Tesla’s announcement of a strategic shift towards more budget-friendly electric vehicles, causing its stock to soar over 13%. Despite this, the initial excitement seemed to fade as the session progressed, with the Nasdaq barely maintaining its position in positive territory by the close.
Tesla’s significant rise, however, came with a caveat; the company fell short of expectations on key financial metrics for the latest quarter, casting a shadow over its impressive stock performance. This mixed outcome reflects the broader market sentiment, where uncertainty seems to be the prevailing mood.
Amidst this backdrop, over a quarter of S&P 500 companies have shared their earnings, with a promising 79% surpassing analysts’ forecasts. This robust performance has ignited a glimmer of hope among traders, suggesting that a strong earnings season could be the catalyst needed to bolster market confidence.
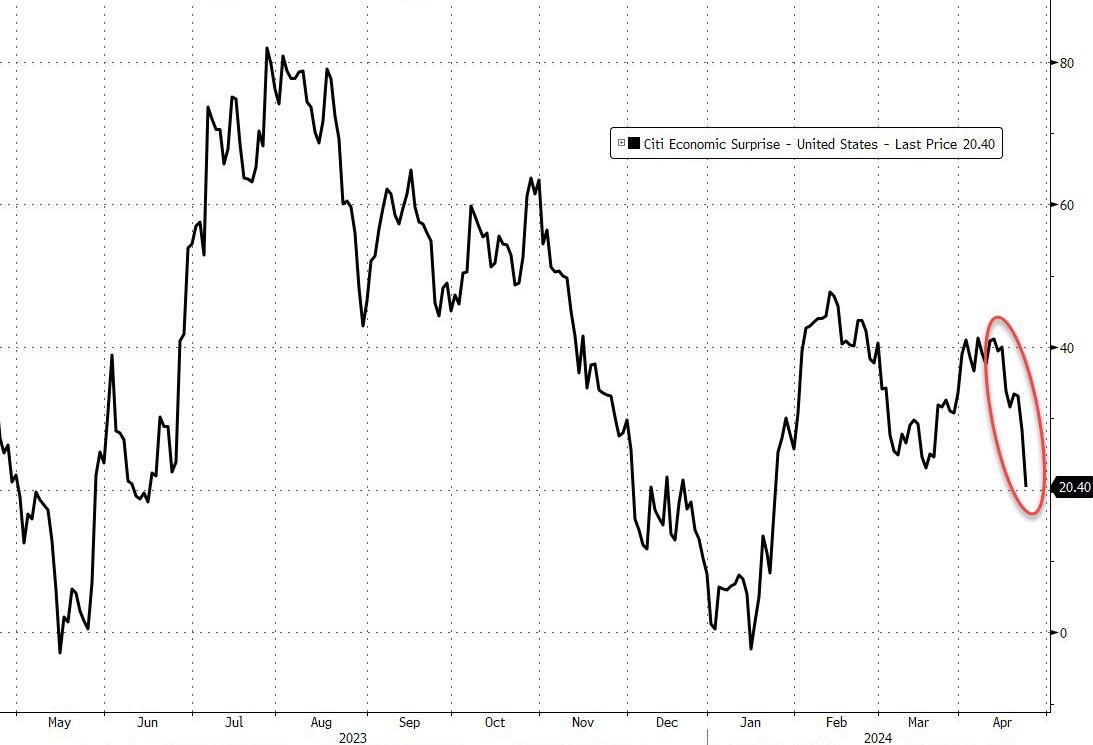
On the economic front, the data painted a somewhat optimistic picture. Orders for durable goods saw a significant uptick of 2.6% in March, a sharp increase from the previous month’s revised figure of 0.7%. However, the impact of this positive news was dampened by substantial downward revisions, rendering the apparent victory less consequential.
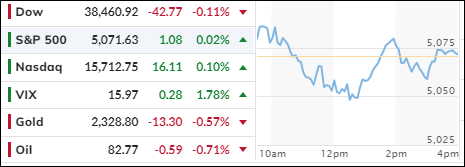
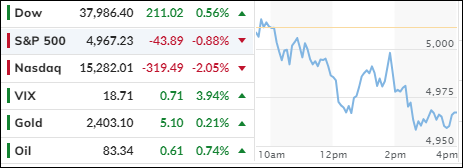
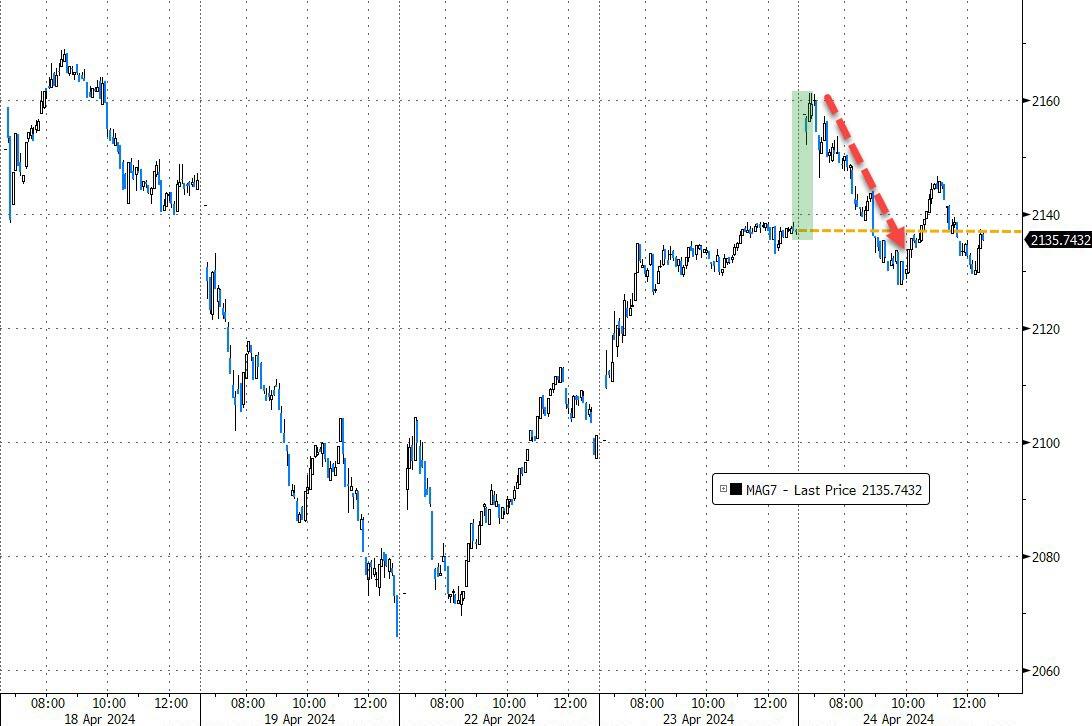
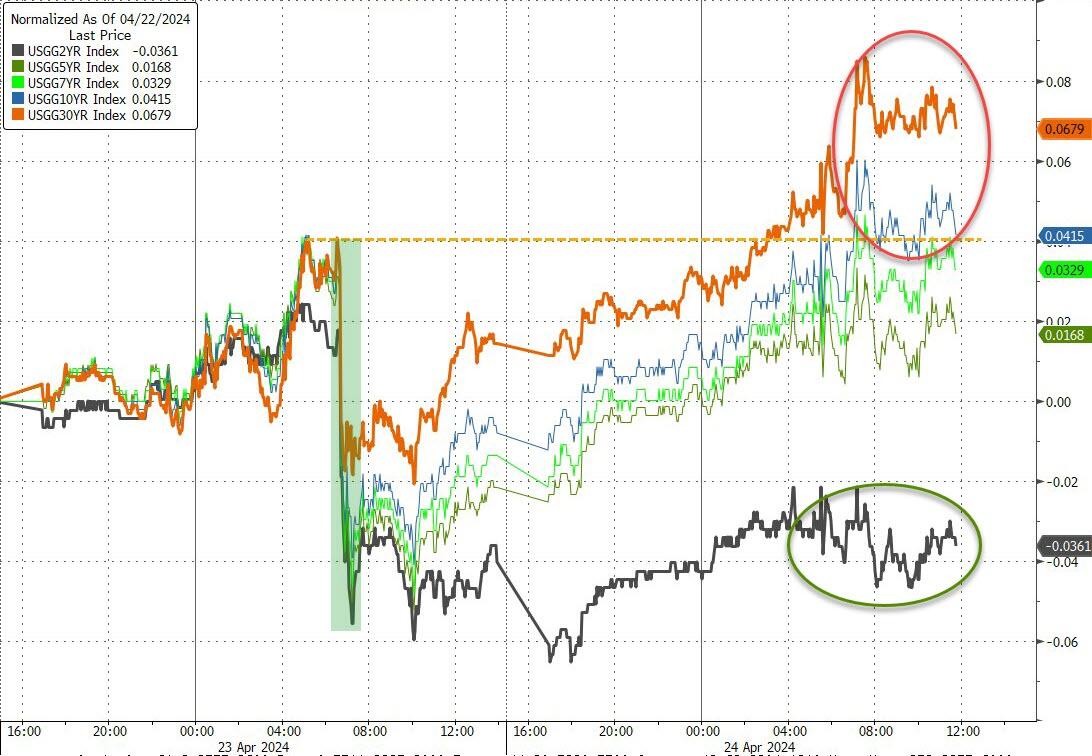
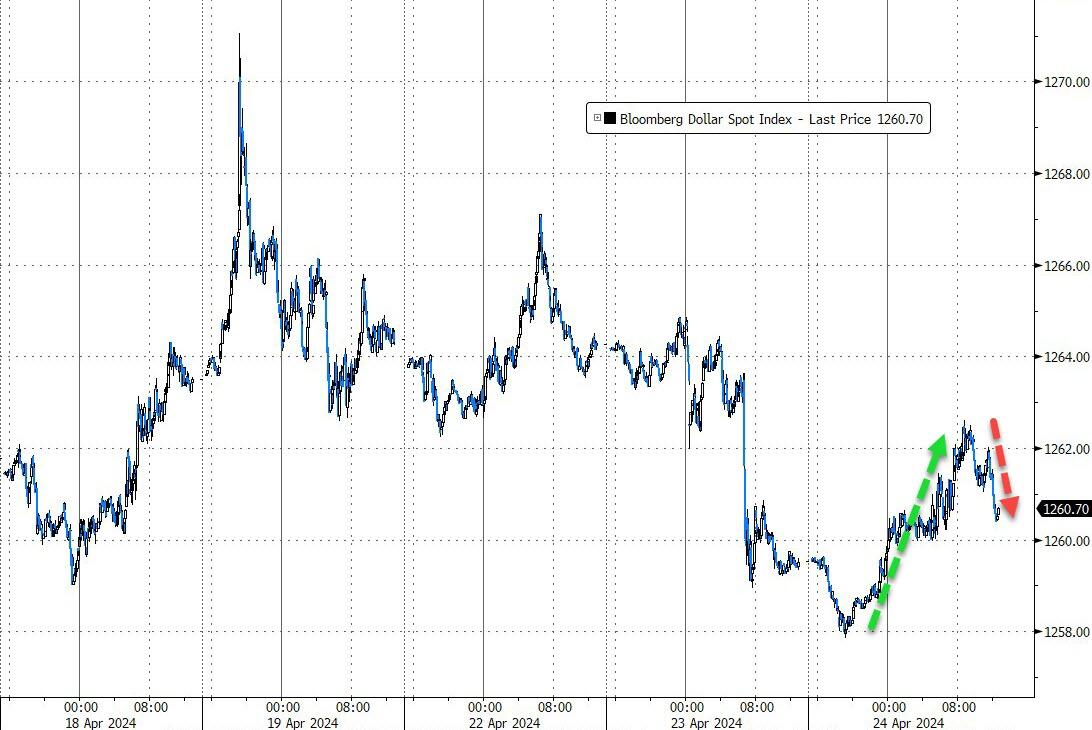
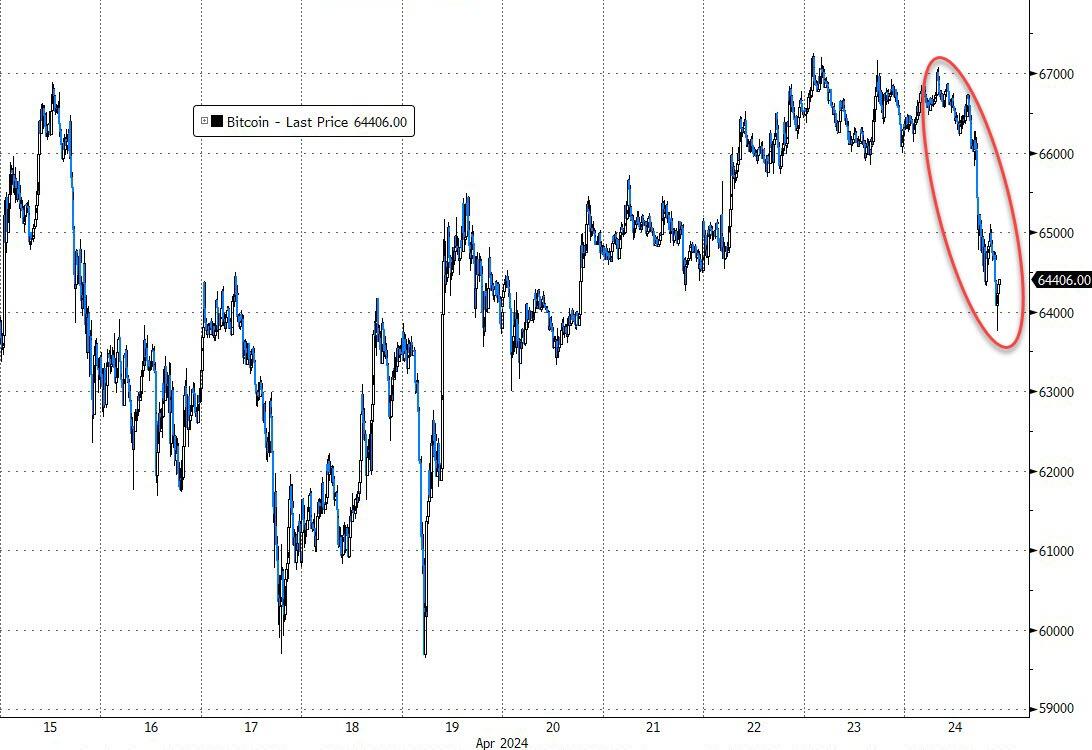
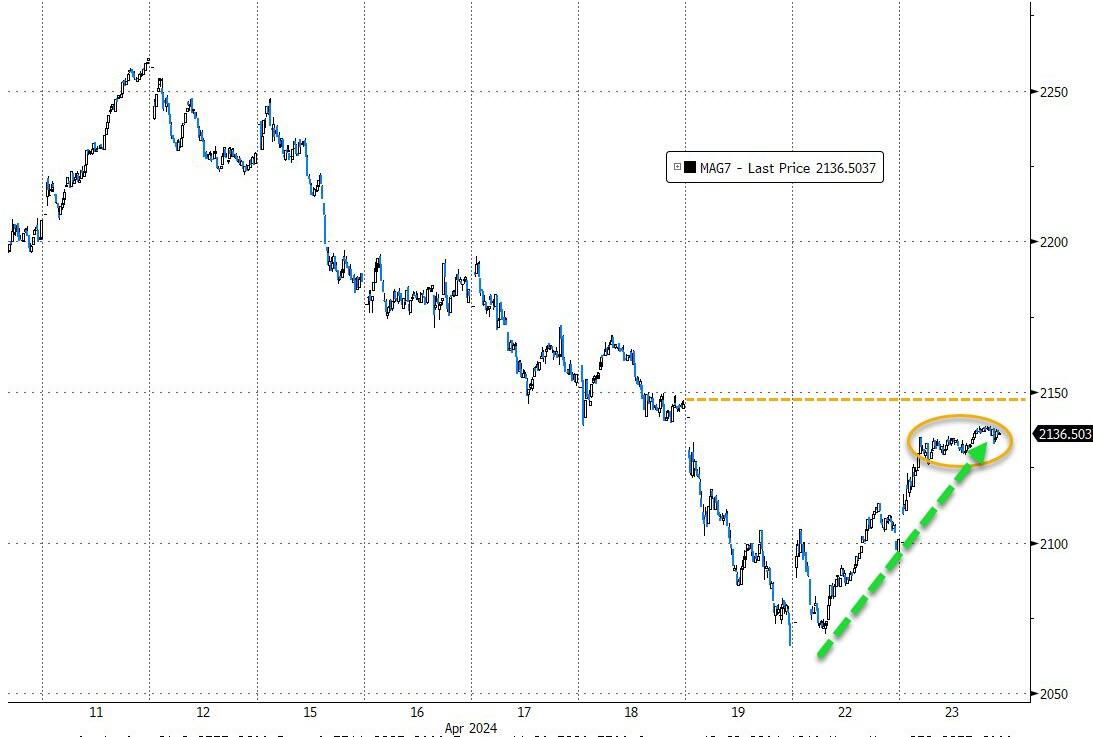
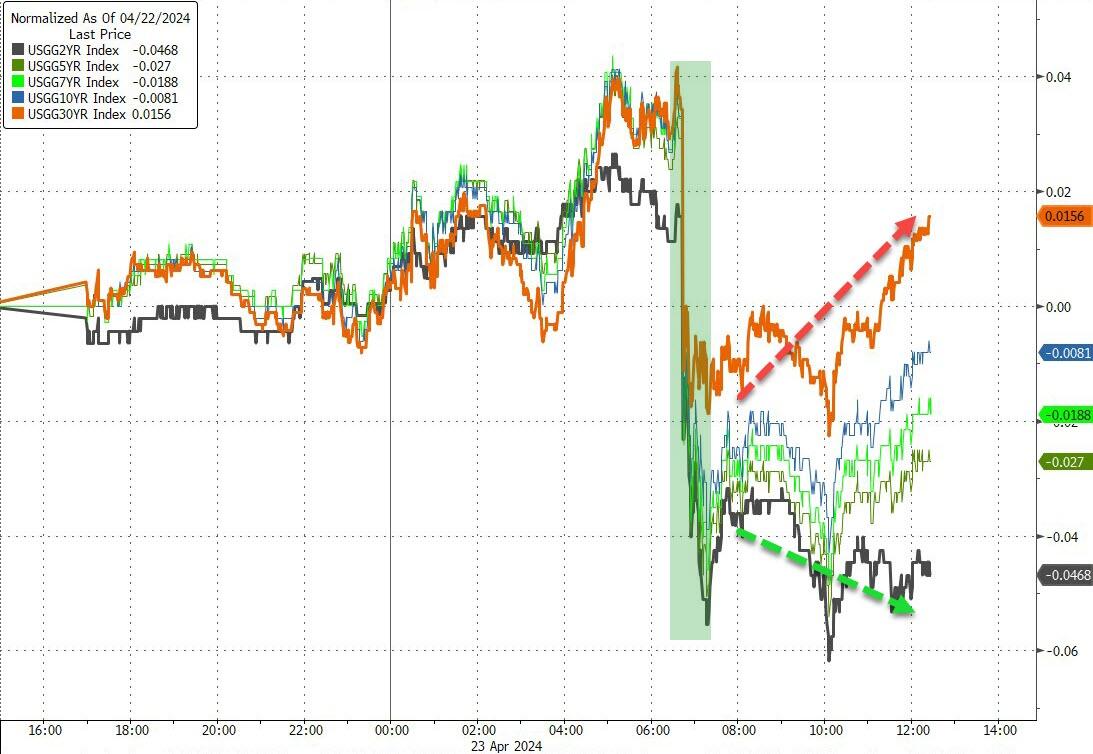
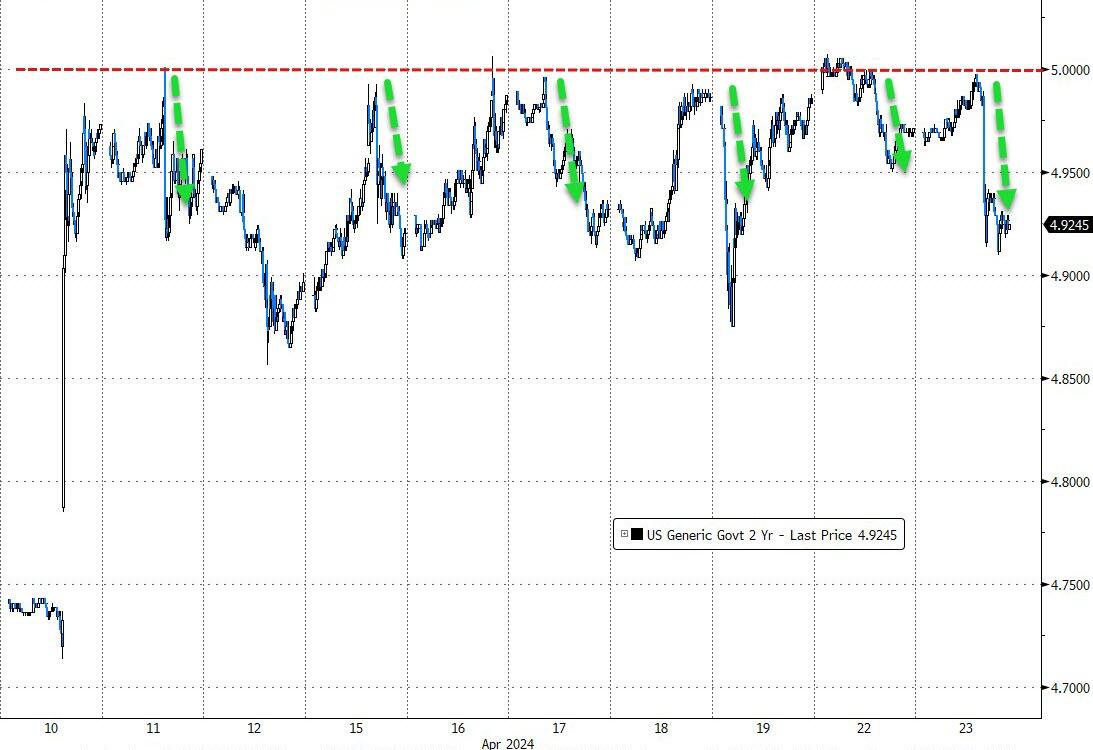
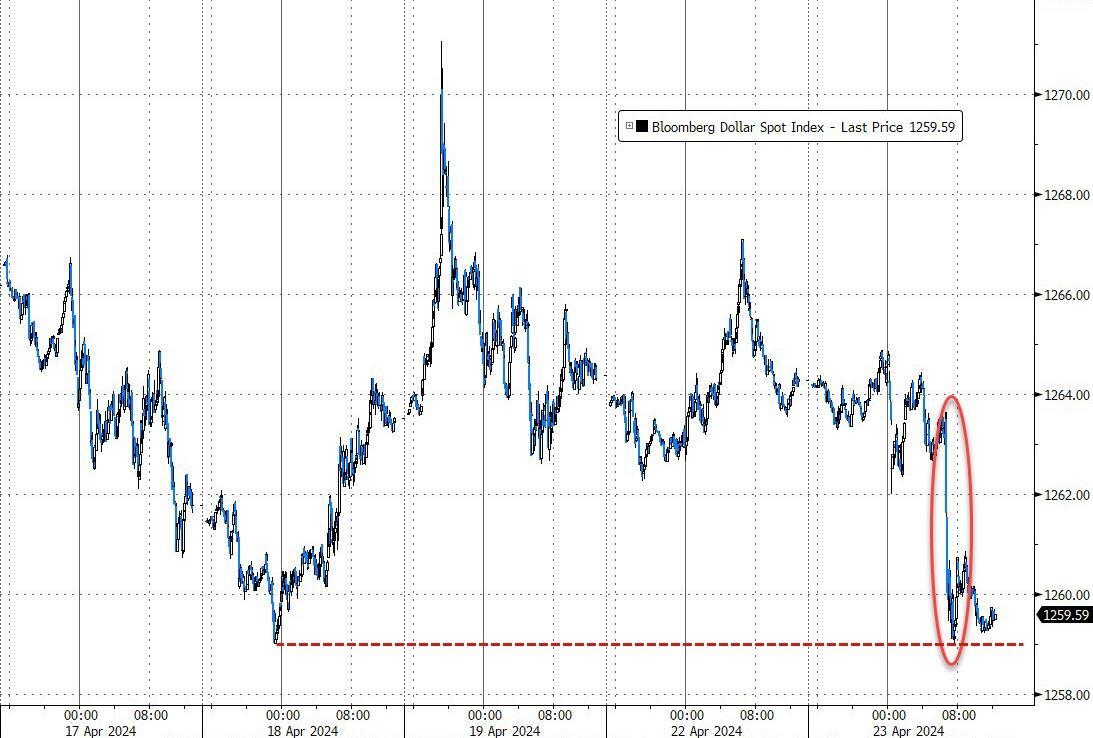
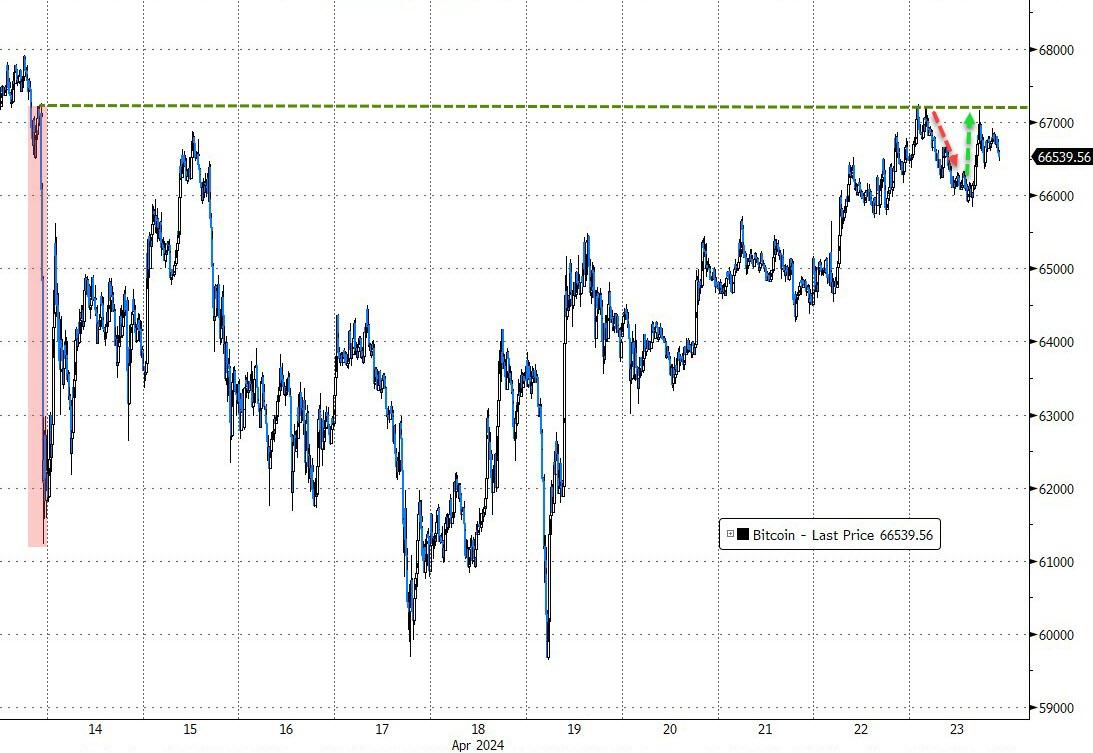
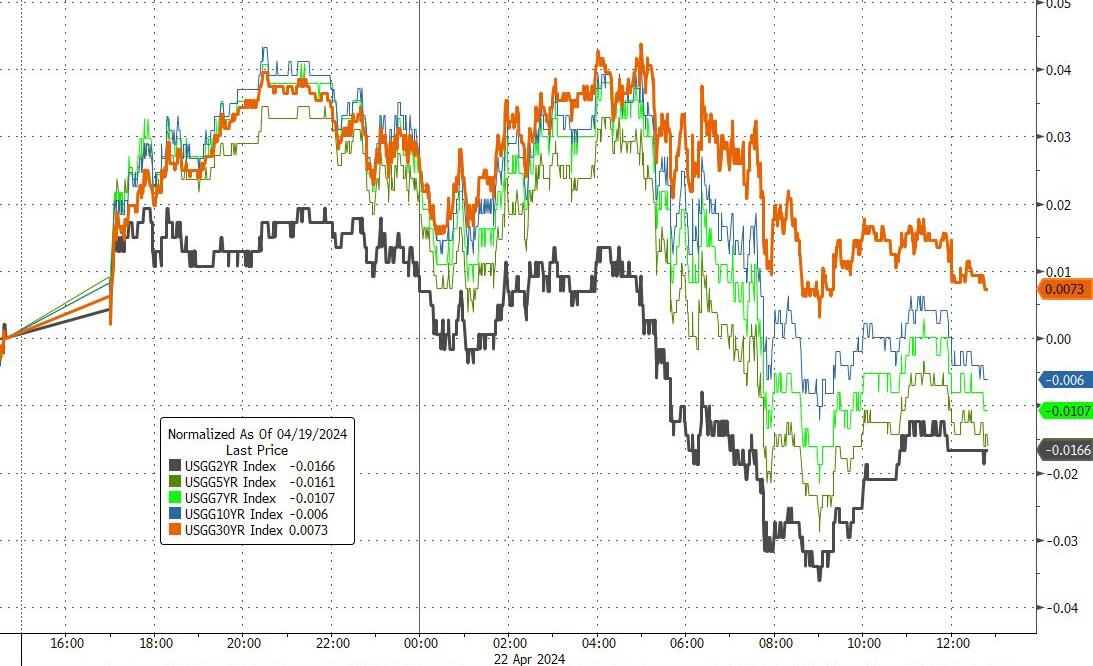
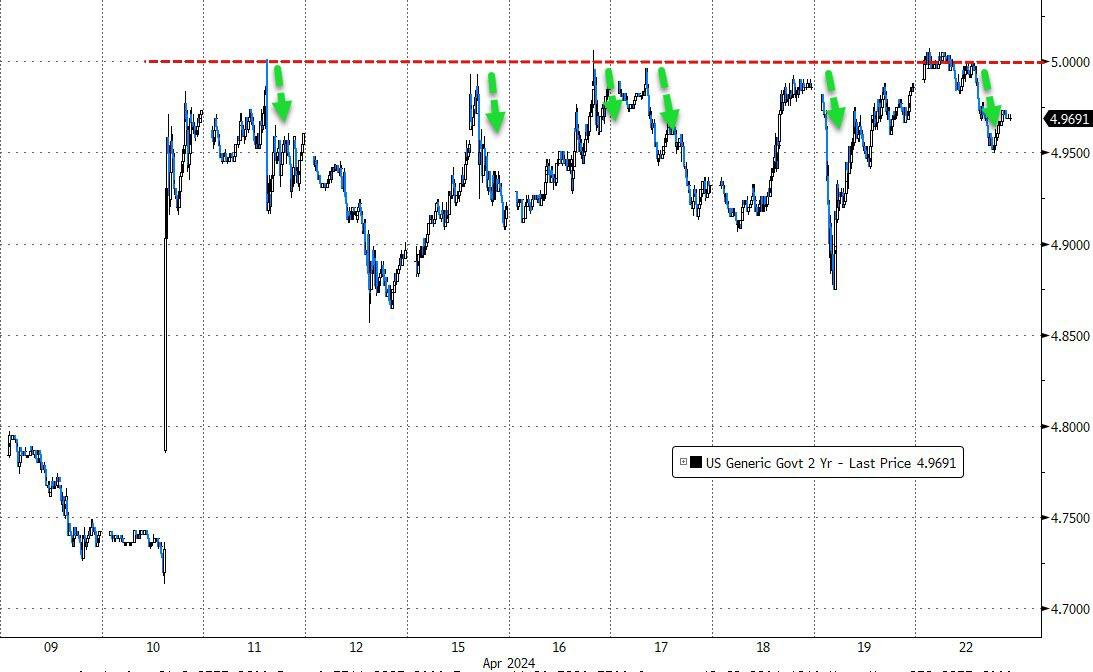
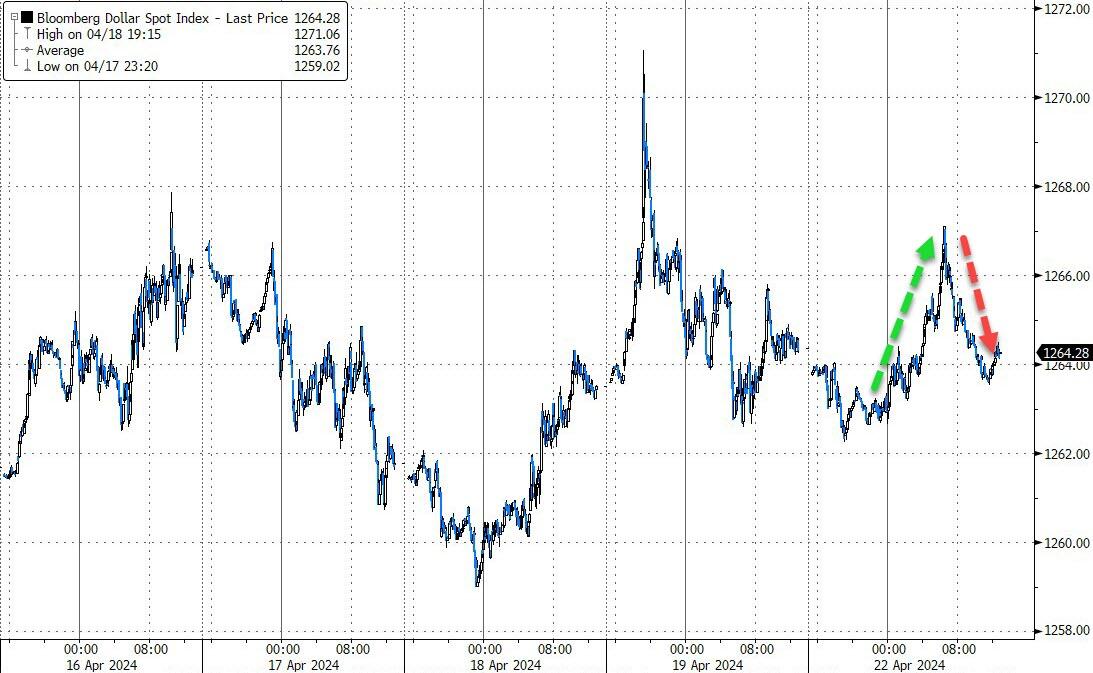
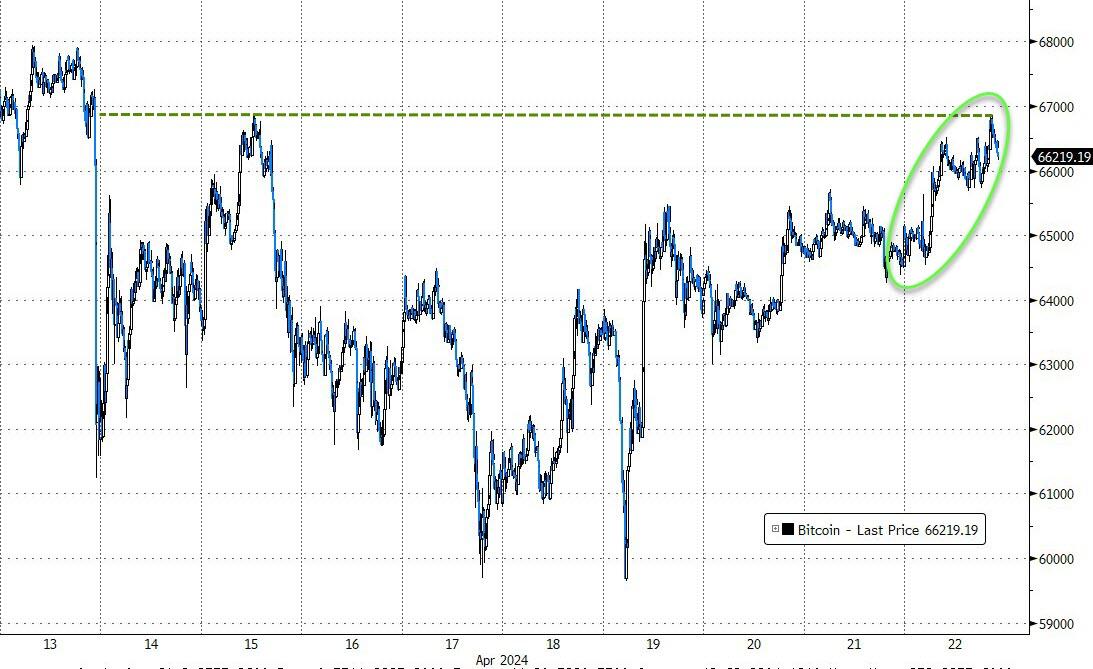
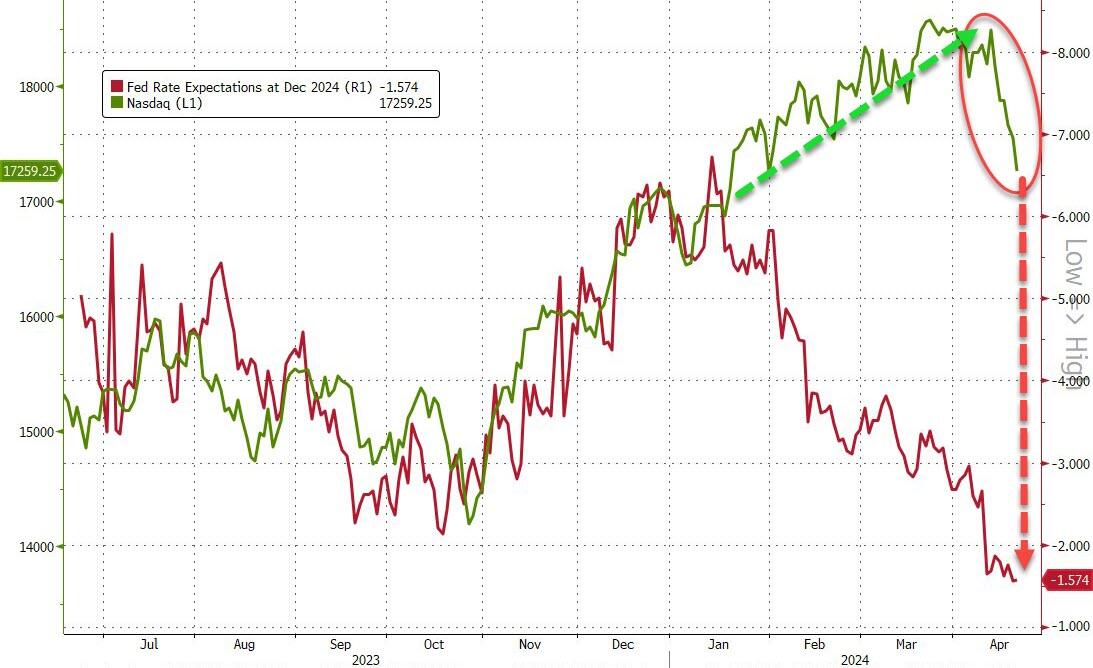
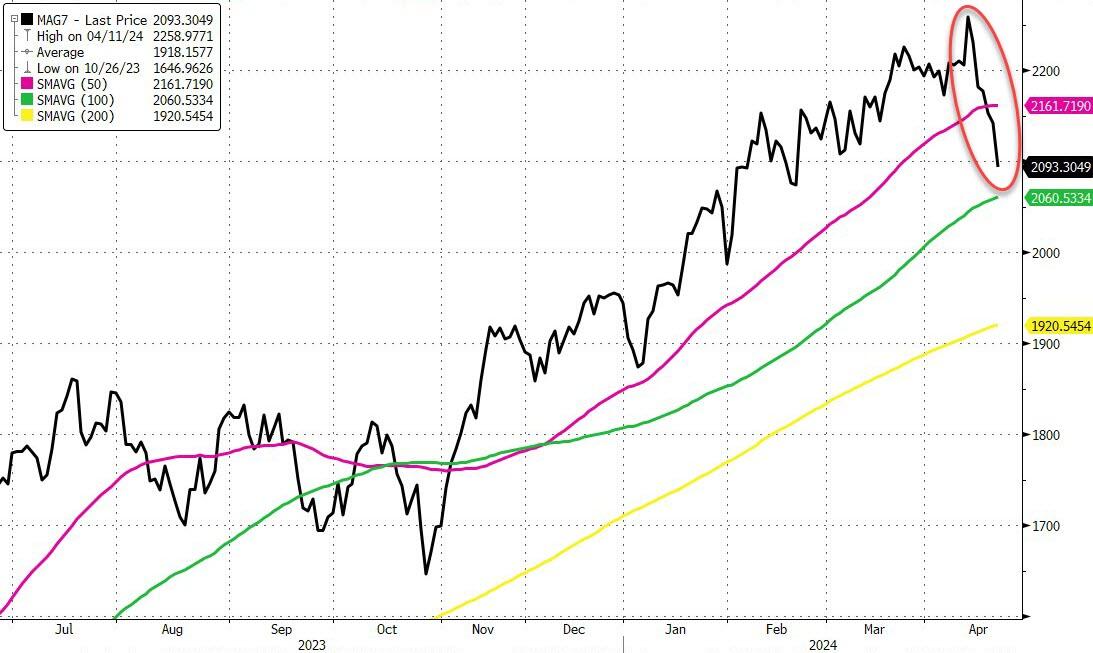
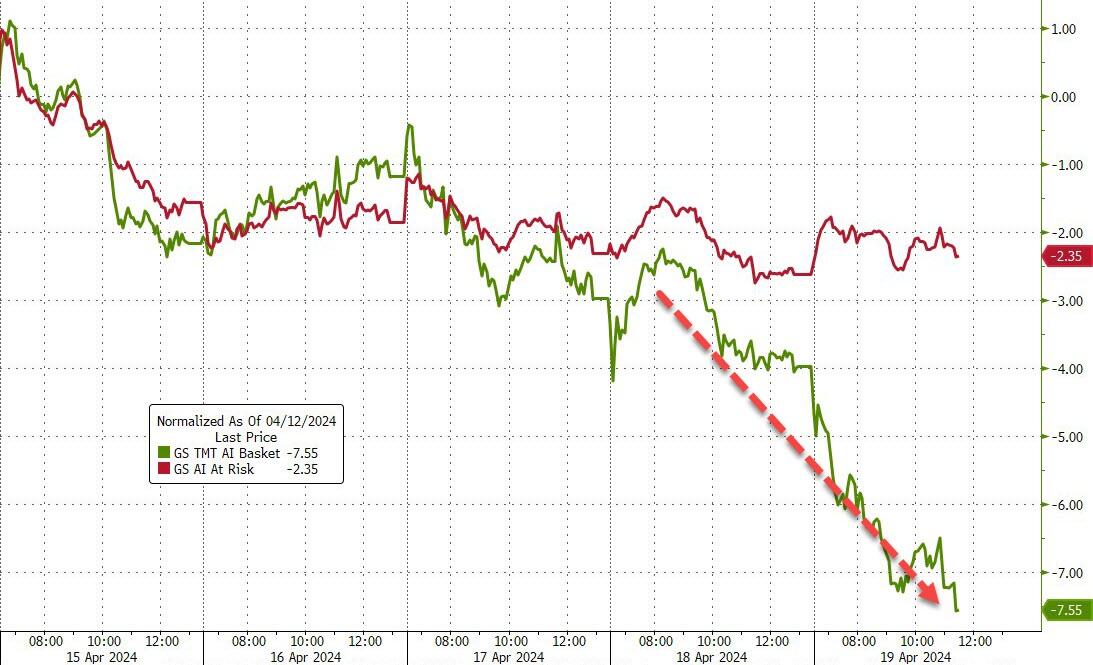
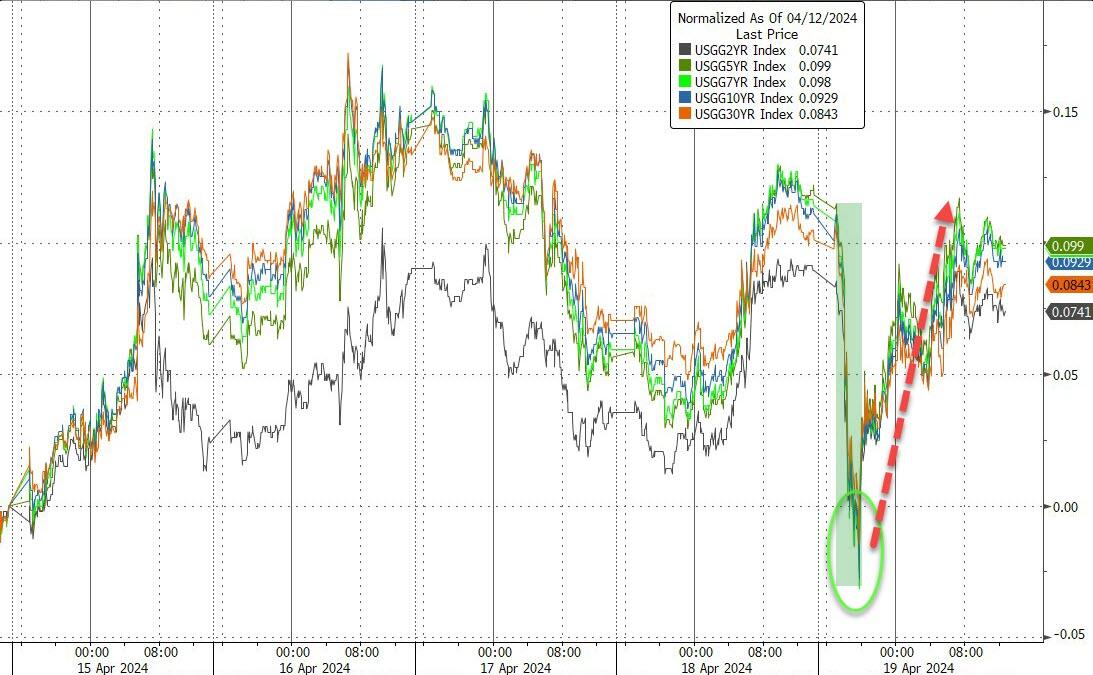
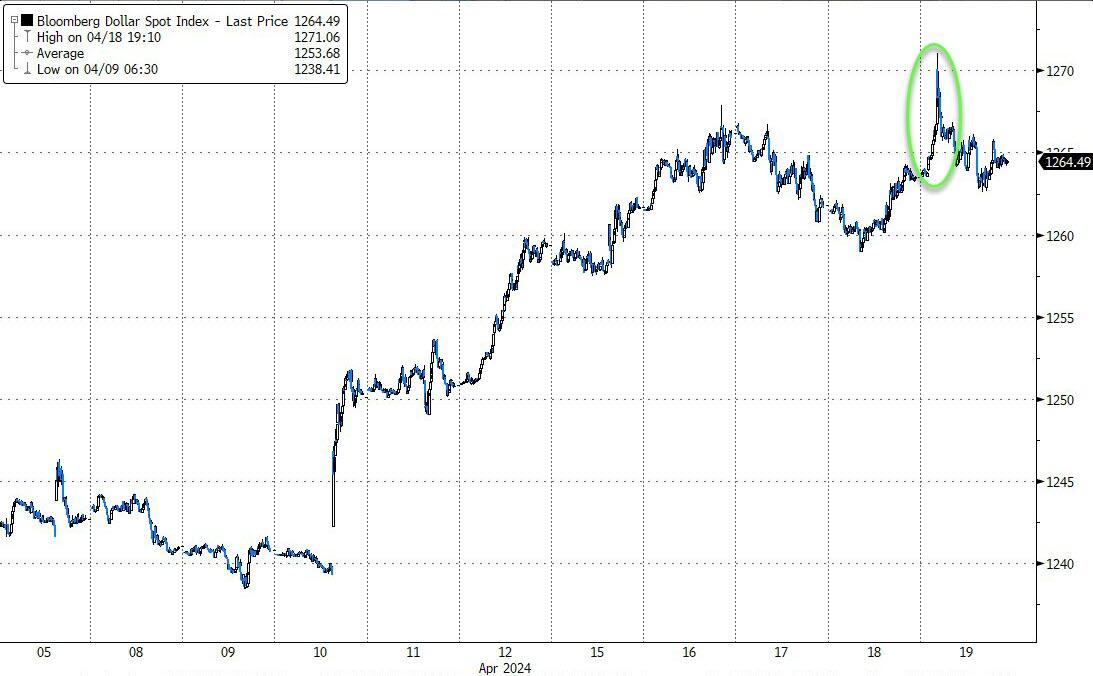
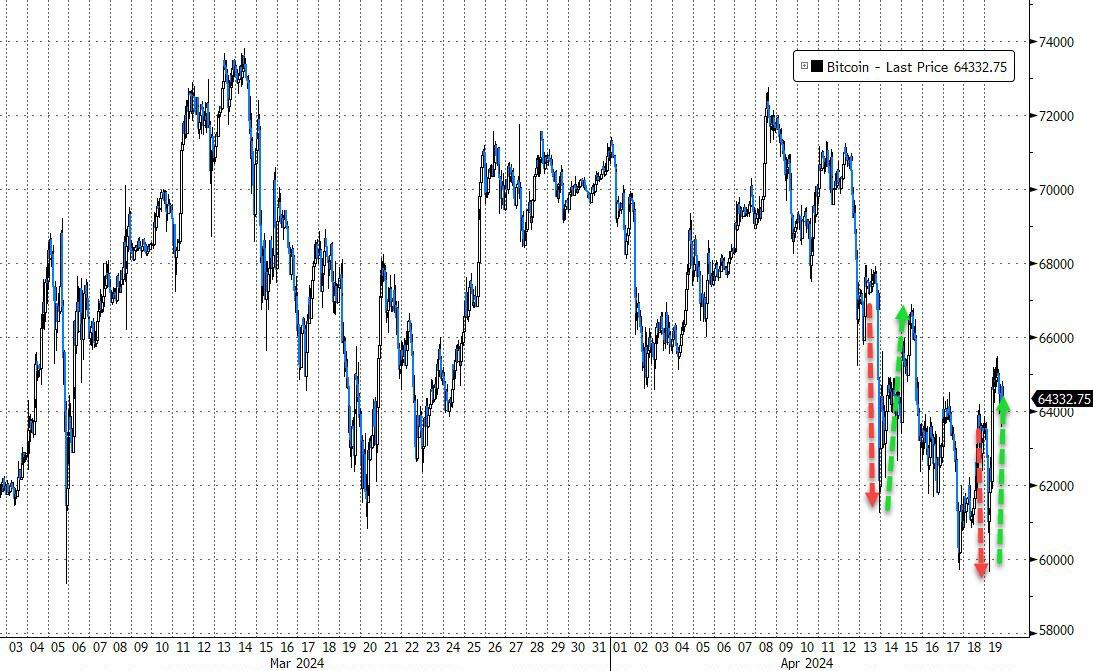
The day’s trading can best be described as chaotic and directionless. Major indexes struggled to find their footing, with the Dow notably trailing in the quest for gains. The MAG7 stocks experienced a volatile session, ultimately ending flat. Meanwhile, bond yields edged higher, the dollar saw moderate gains, and Bitcoin, despite a slight decline, managed to hold steady at the $63,000 mark.
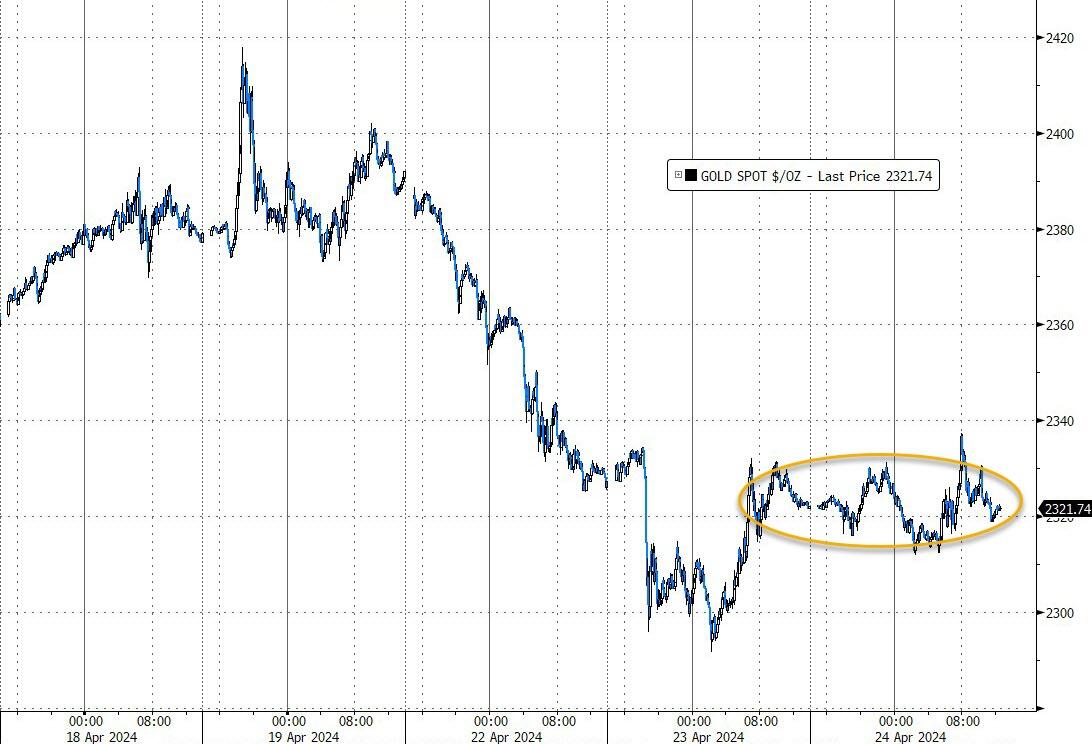
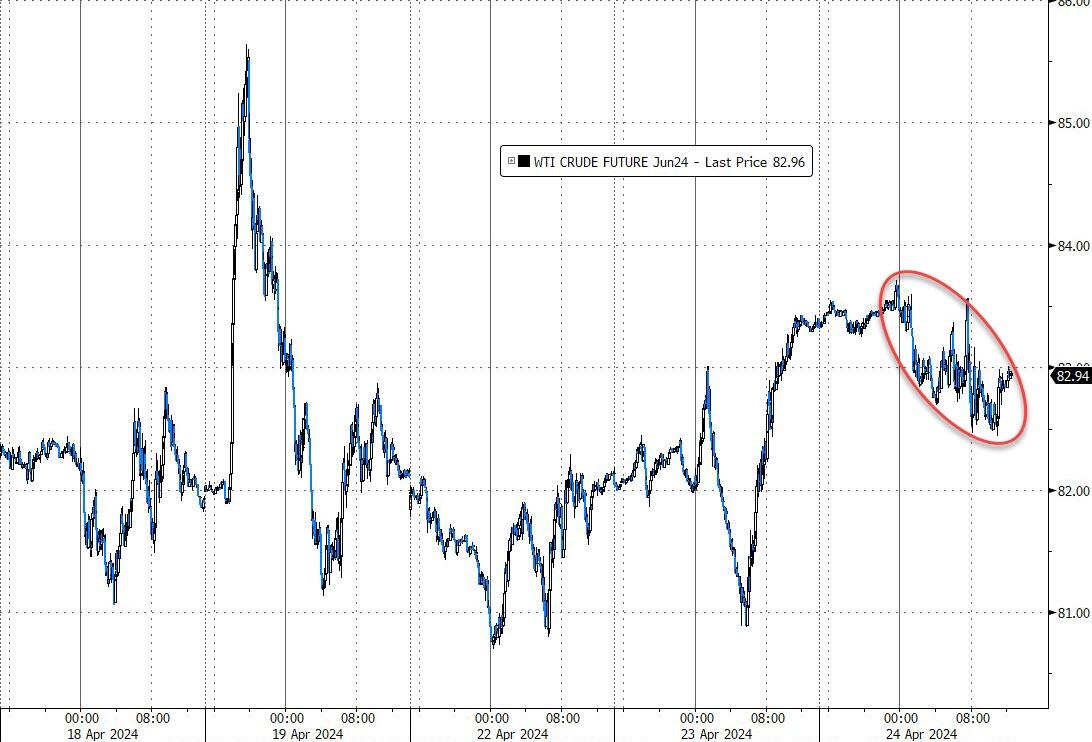
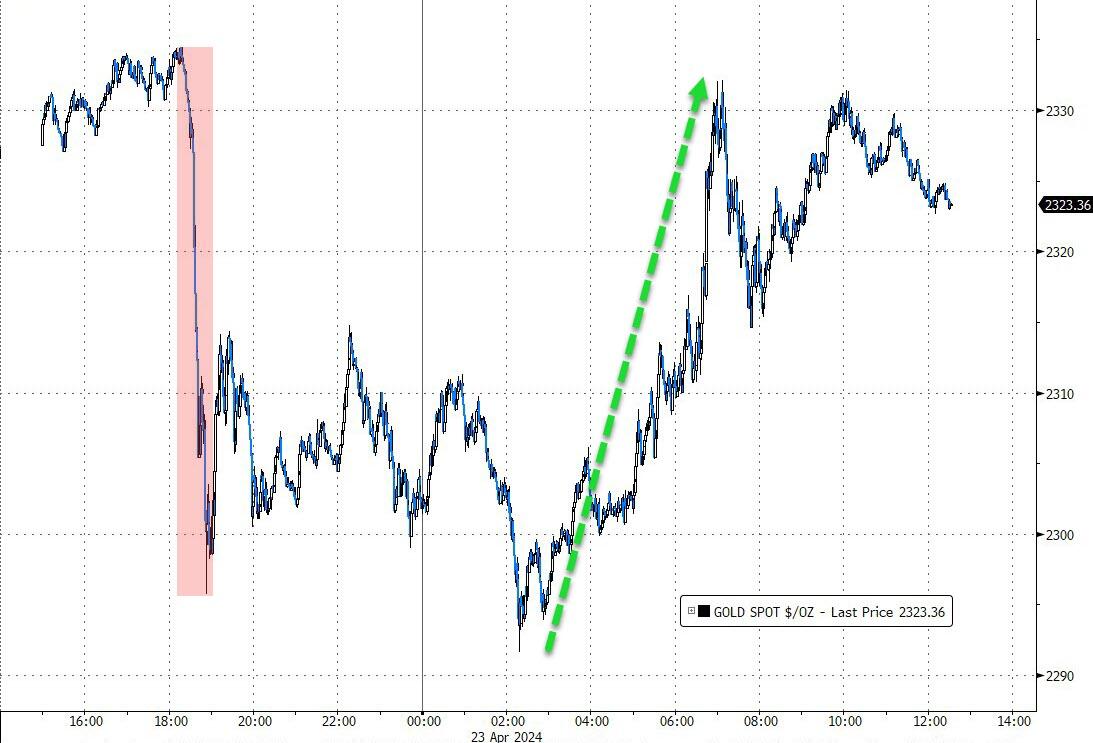
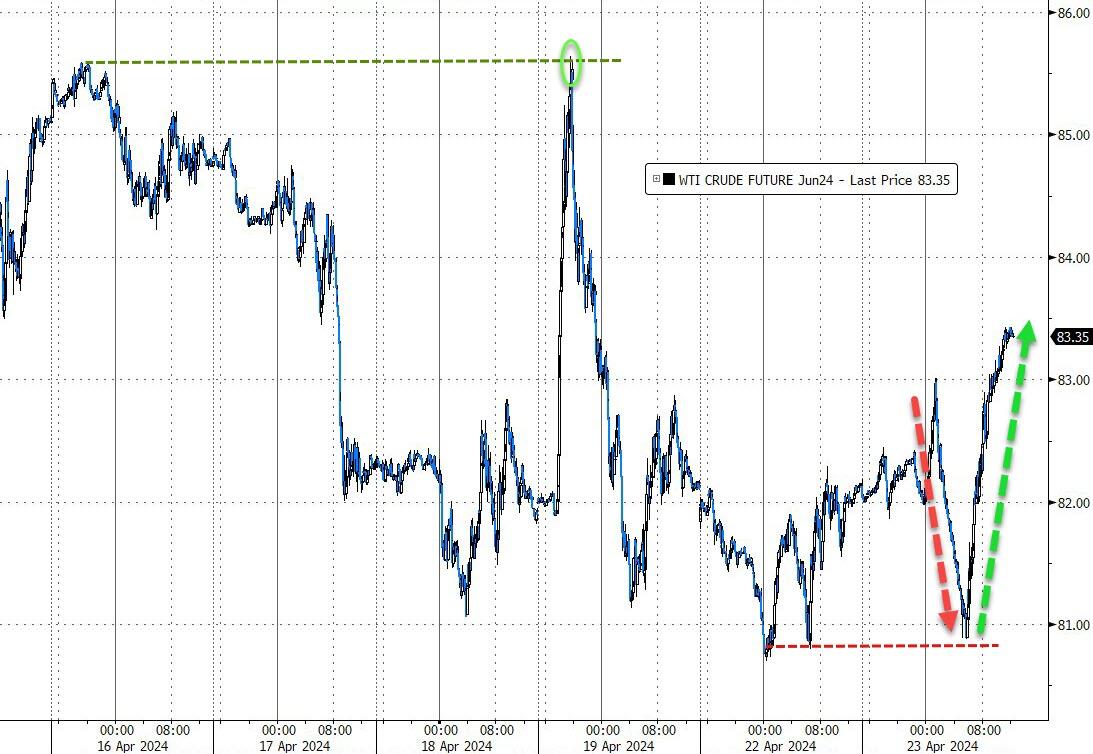
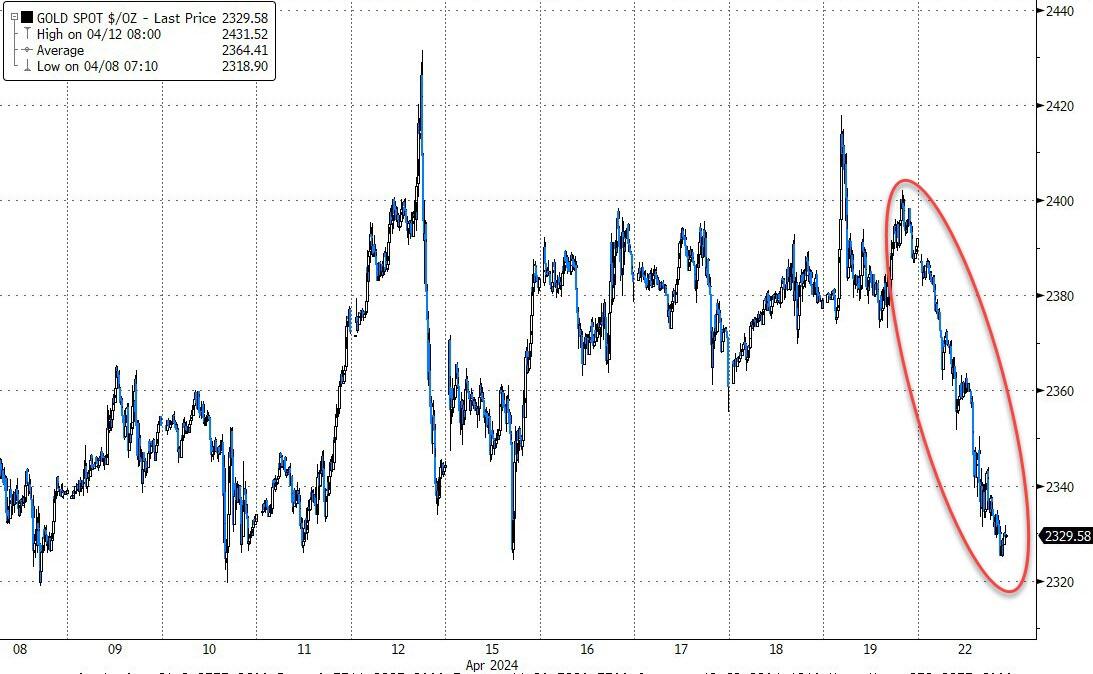
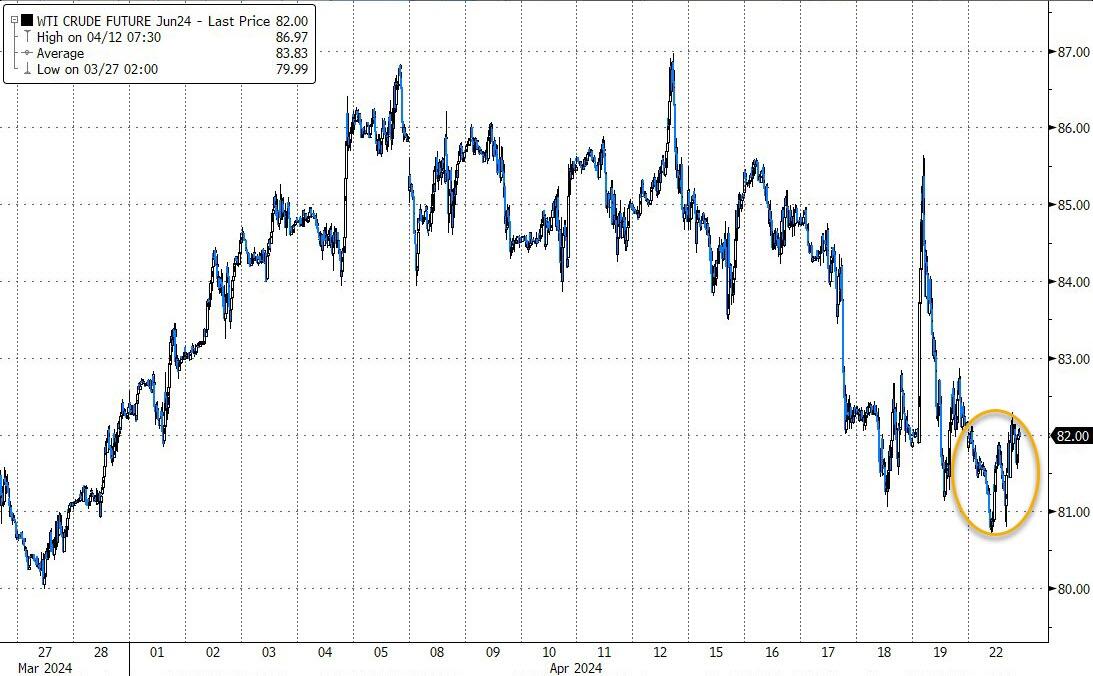
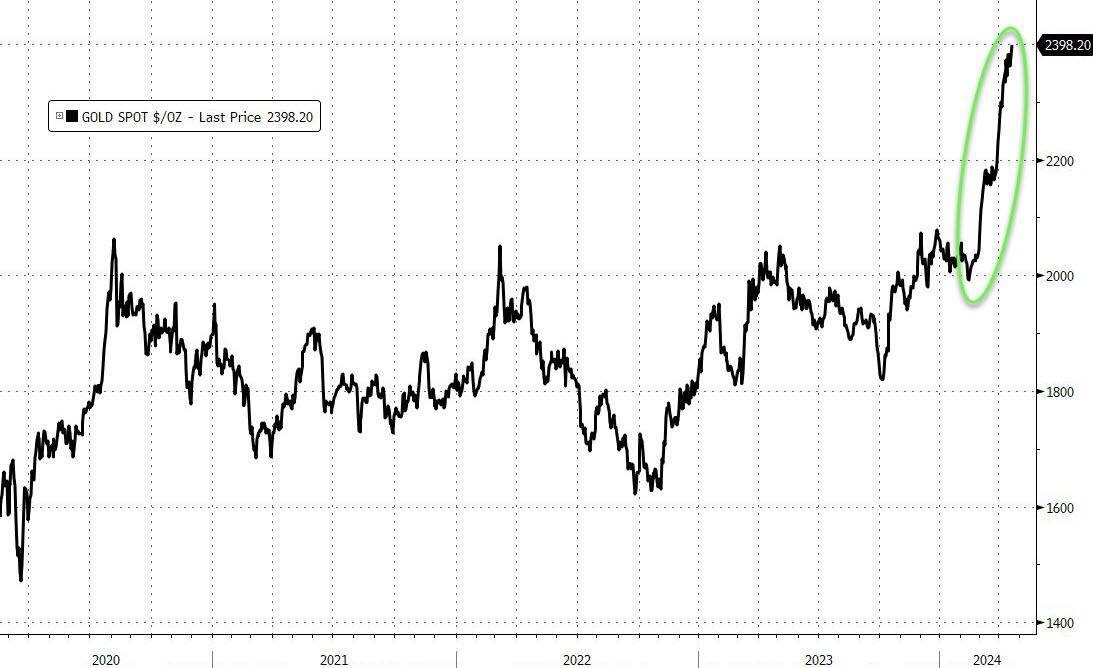
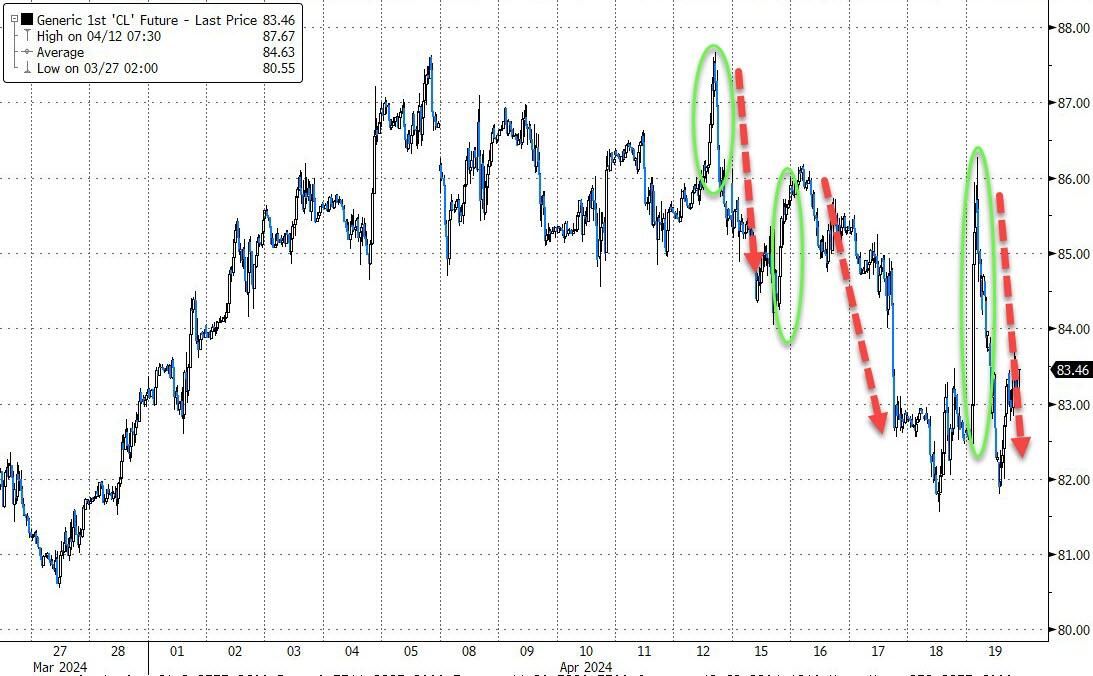
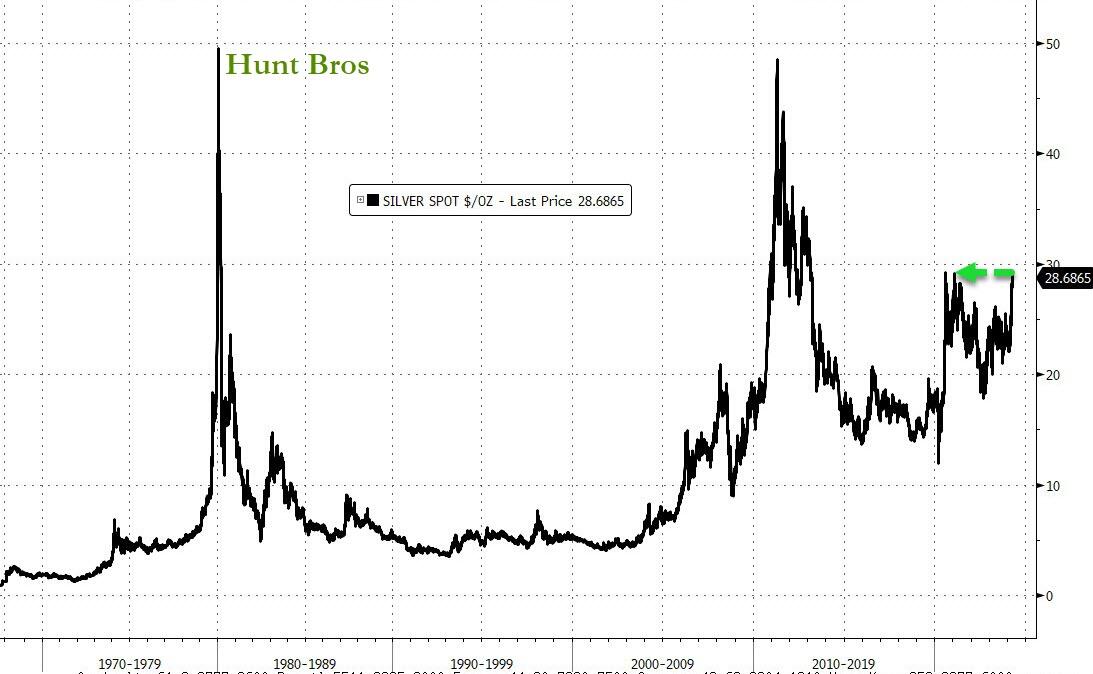
Gold and crude oil, typically seen as safe havens, were unable to provide a respite from the market’s indecisiveness. Both commodities traded within a tight range and eventually succumbed to the same fading momentum that characterized the day’s trading.
As the dust settled, the session concluded with little to show in terms of progress, leaving market watchers to ponder the future.
One can’t help but wonder, what will be the decisive factor that either propels the markets forward or triggers a retreat from current levels of support?
Here are some headline options for this market summary:
Read More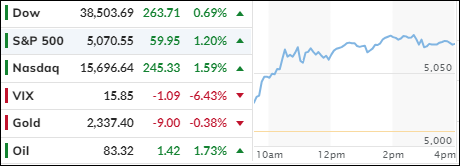
