Earnings Season Surge: U.S. Stocks Rally Amid Positive Momentum

Ulli Market Commentary Contact

[Chart courtesy of MarketWatch.com]

  1. Moving the markets

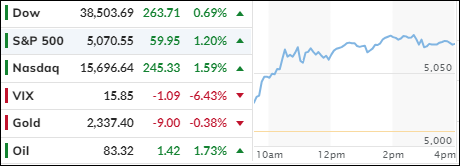
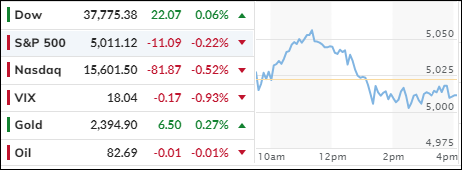
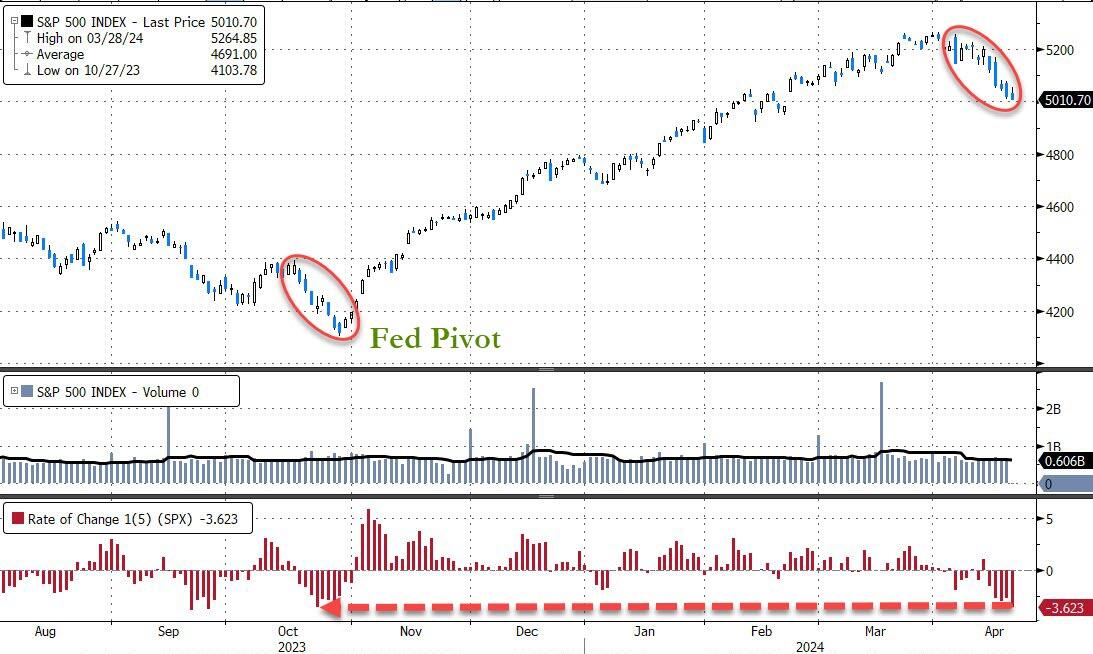
In today’s financial landscape, the U.S. stock market experienced a significant rally, energized by the unfolding corporate earnings season. Investors were keen to capitalize on the robust gains from the previous session, setting a positive tone for the market.

The anticipation was palpable as Tesla prepared to release its earnings report after the market closed, marking the beginning of a series of high-profile earnings announcements. Meta Platforms is expected to follow suit on Wednesday afternoon, with the tech giants Alphabet and Microsoft completing the lineup later in the week.

The earnings season has been off to a promising start, with about a fifth of the S&P 500 companies having reported by Tuesday morning. Of these, an impressive three-quarters have surpassed analysts’ expectations, suggesting a resilient corporate sector.

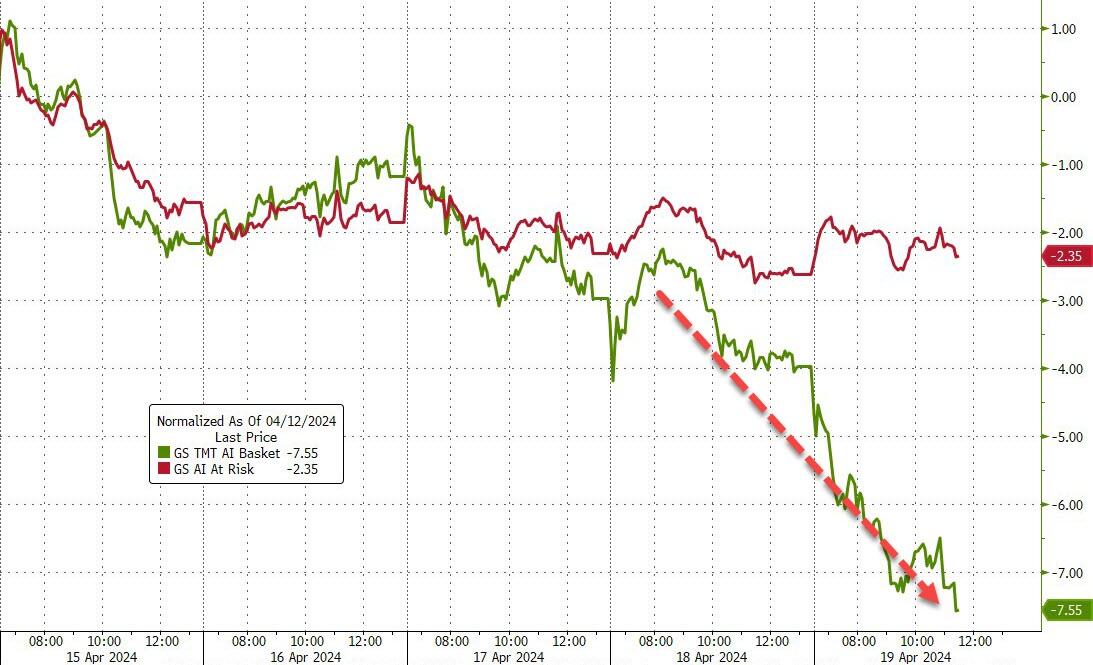
This upbeat trend in earnings comes as a welcome change, especially after the recent downturn in technology stocks. Names like Nvidia had suffered losses amid concerns over rising inflation and the potential for higher interest rates, but investors showed renewed confidence, engaging in strategic buying to leverage the dip in prices.

The real estate market also delivered some unexpected, good news, with new residential home sales in March accelerating at a pace that outstripped forecasts. The sales figures for single-family homes stood at 693,000 for the month, a notable increase from the revised figure of 637,000 in February and surpassing the Dow Jones estimate of 669,000.

This surge in sales led to an 8.8% gain in March, significantly higher than the anticipated 1.1%. Furthermore, the median sales price soared to $430,700, the highest it has been since the previous August, indicating a robust demand in the housing market.

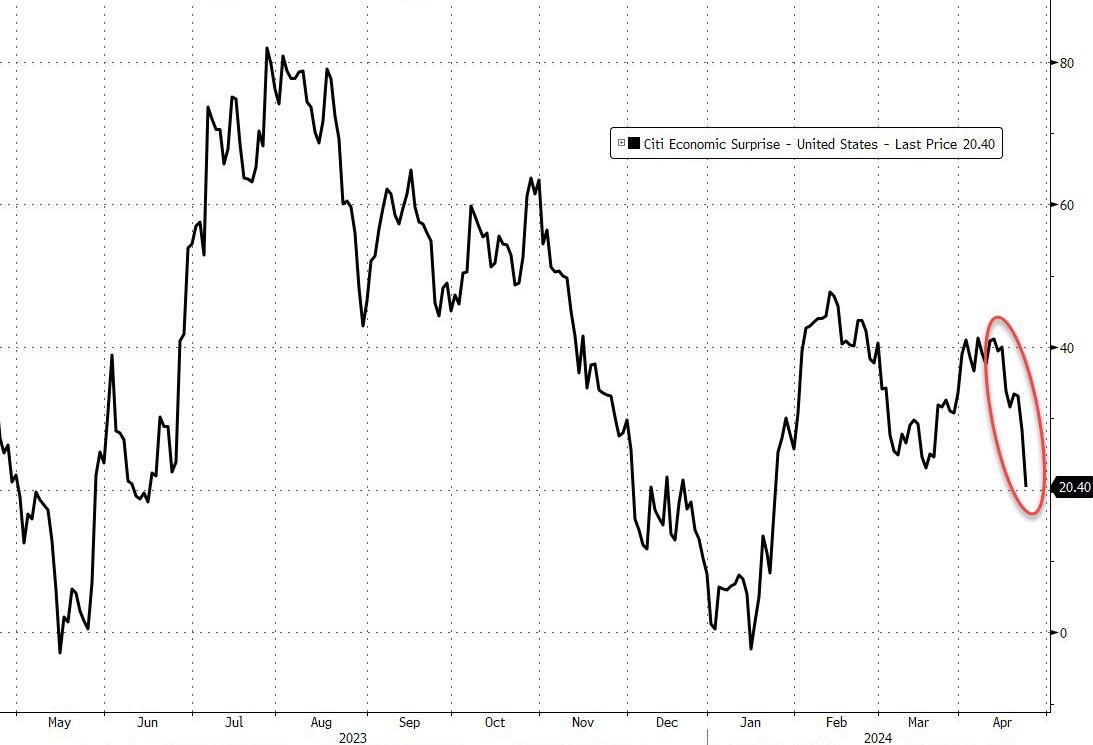
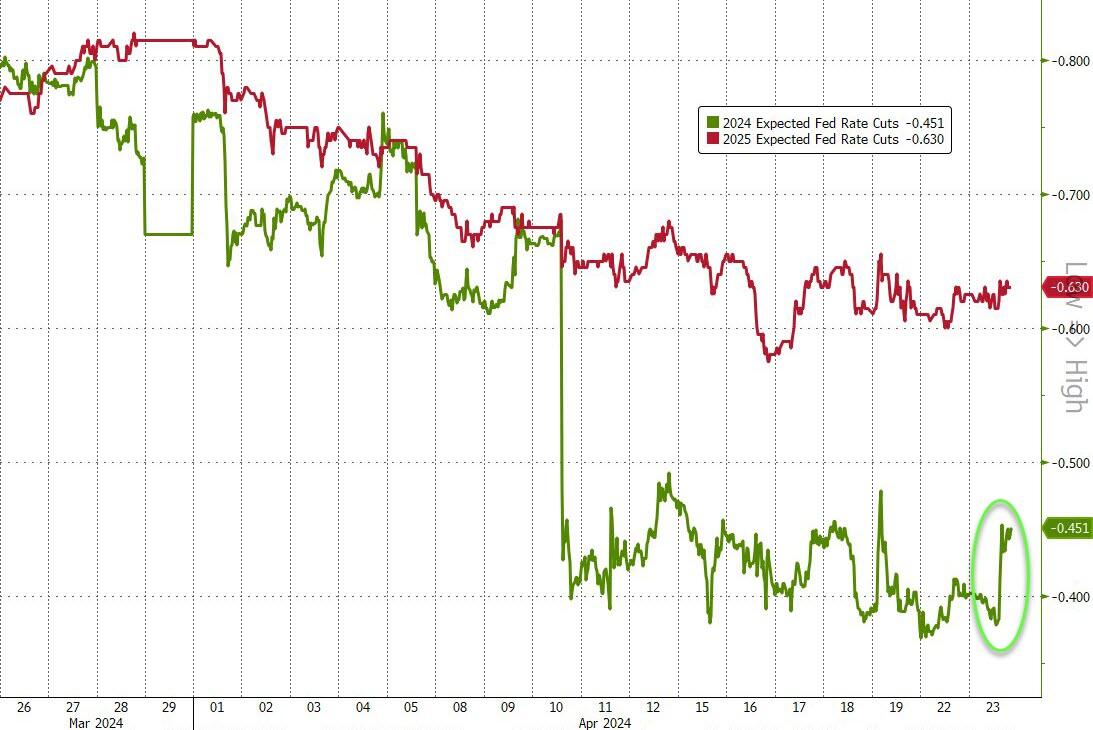
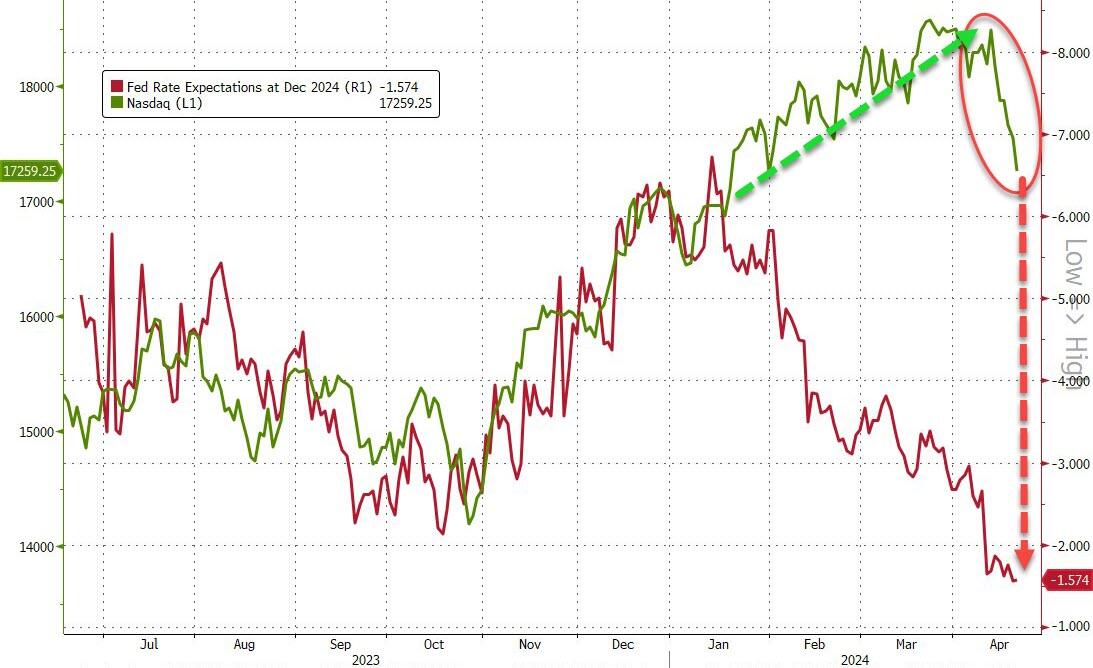
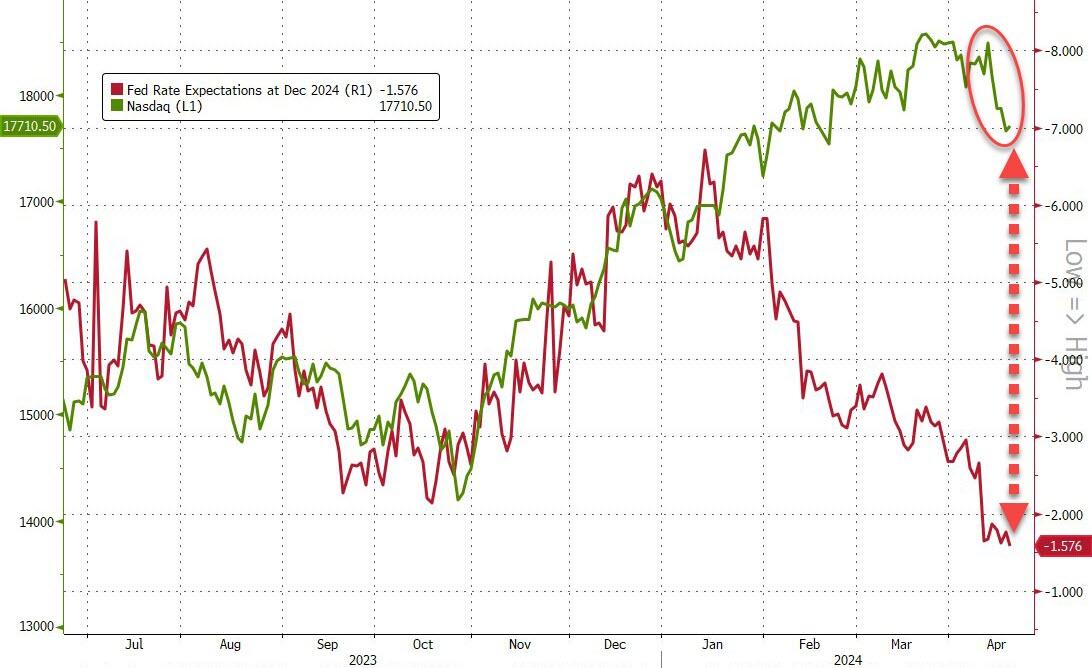
The broader economic picture paints a complex yet intriguing scenario. Despite a decline in manufacturing and services data, which caused the Macro Surprise index to falter, the market interpreted this as a harbinger of potential rate cuts in 2024. This paradoxical reaction, where bad news is perceived as good news, underscores the market’s nuanced dynamics.

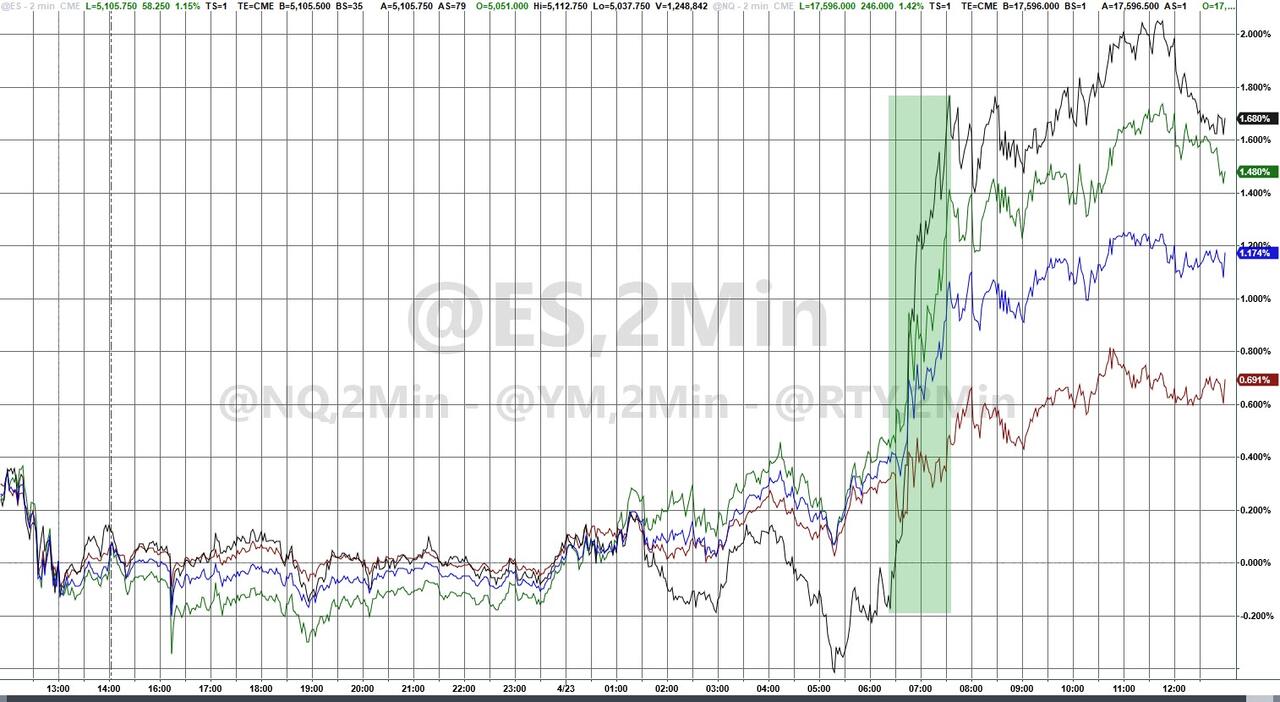
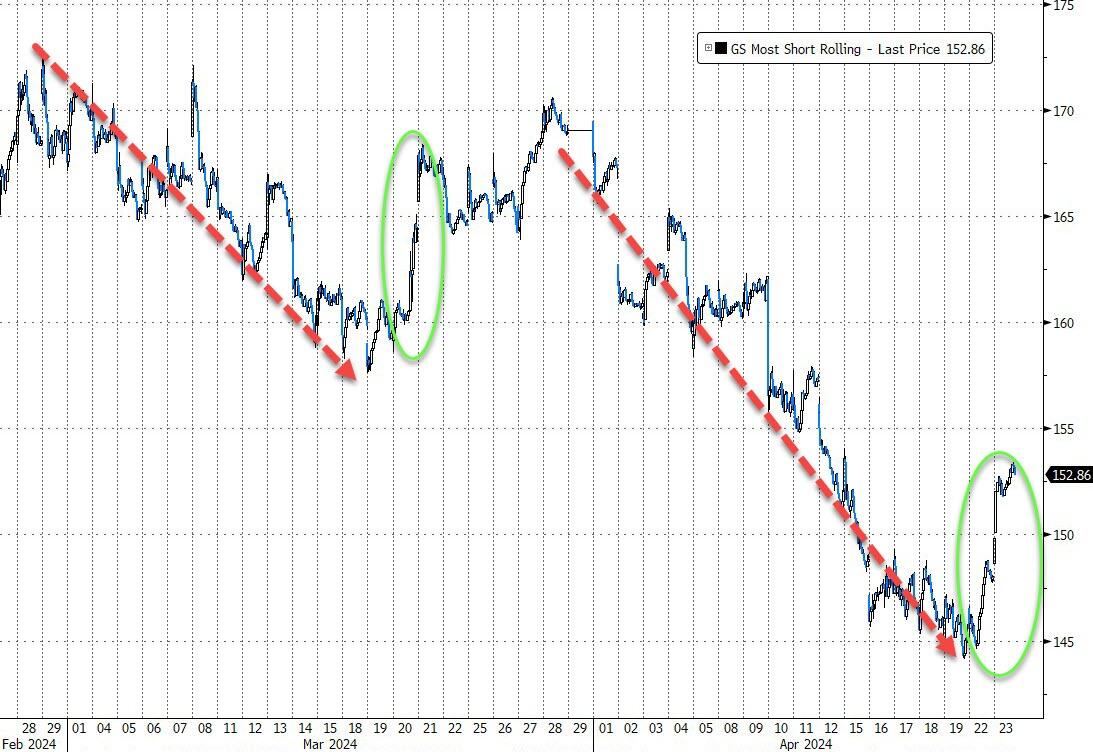
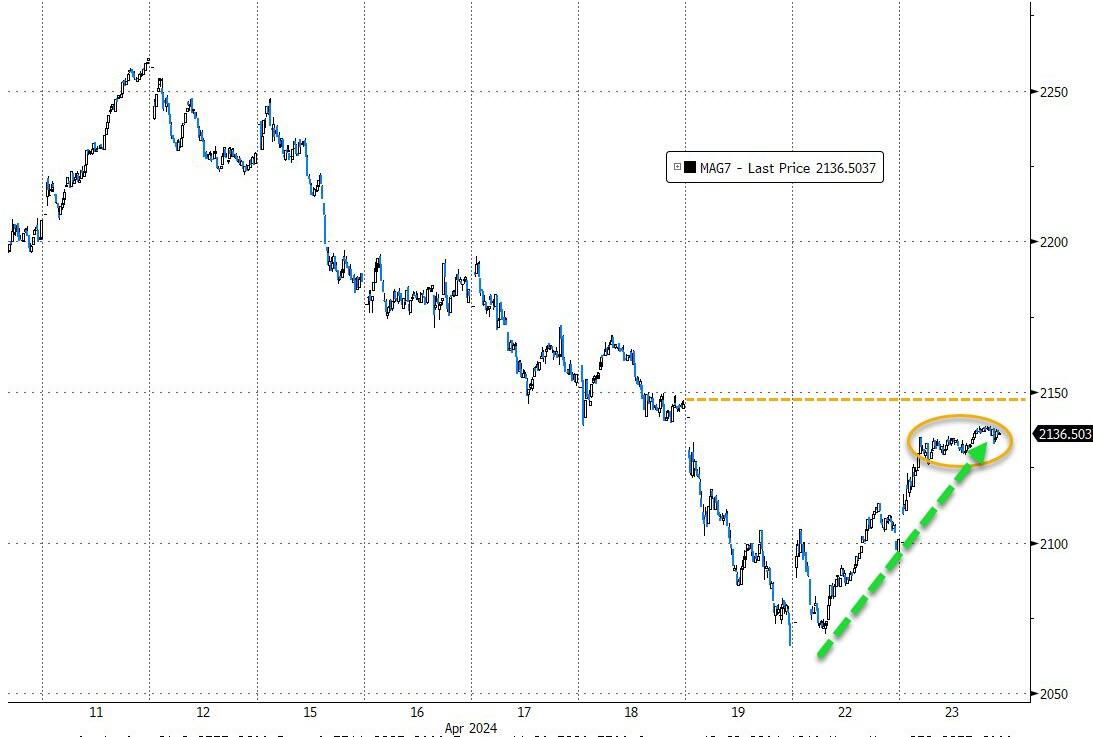
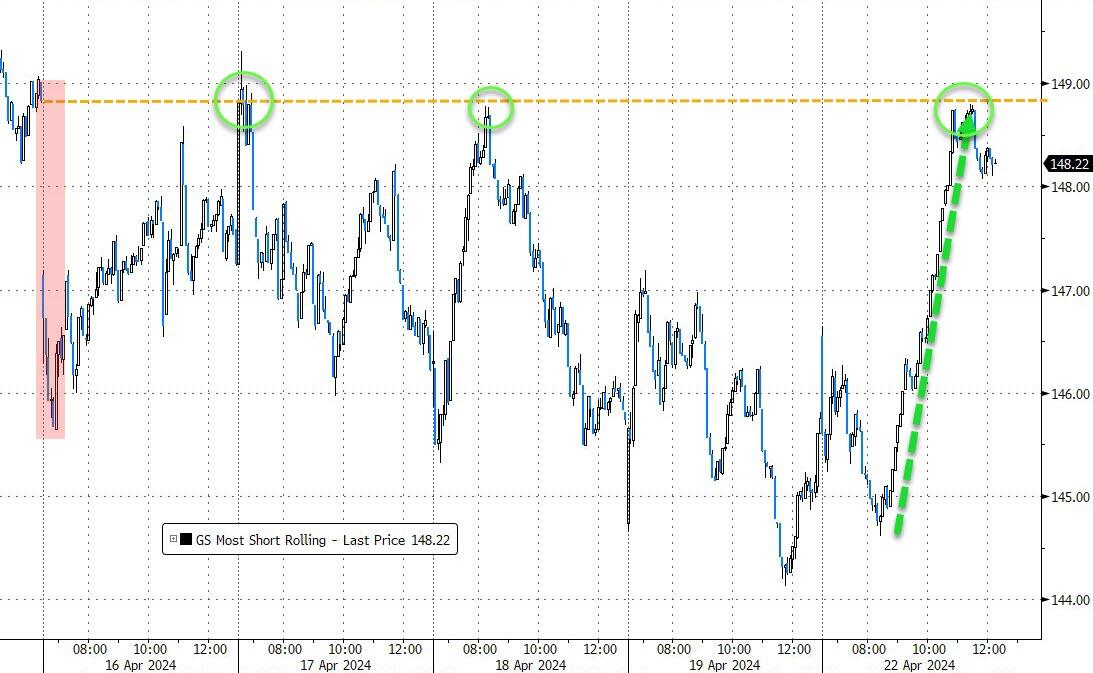
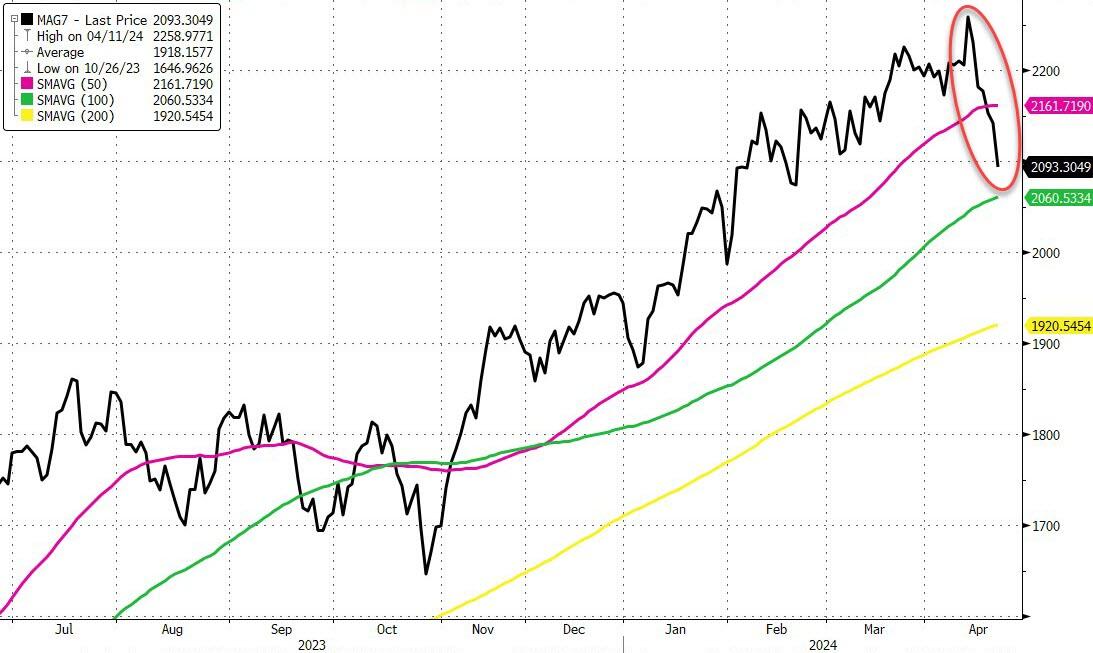
The previous day’s short squeeze escalated, resulting in the most substantial two-day squeeze since the end of February. The major tech stocks, collectively known as the MAG7, participated in this upward trend, although they fell short of erasing the week’s earlier losses.

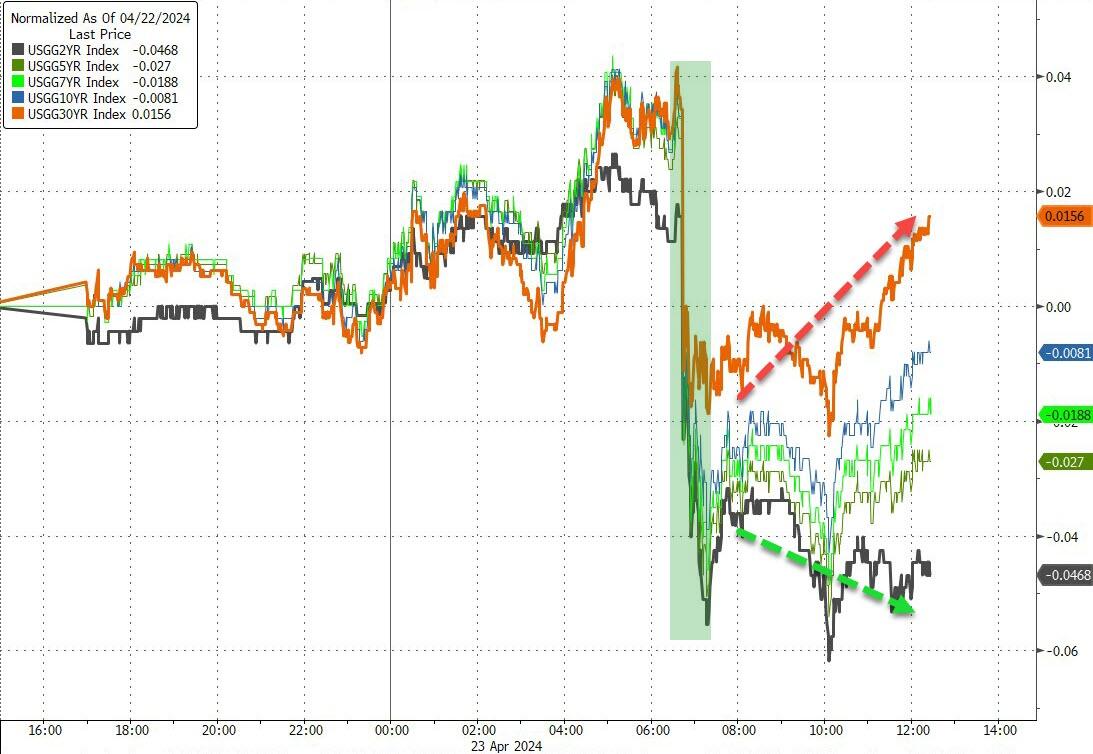
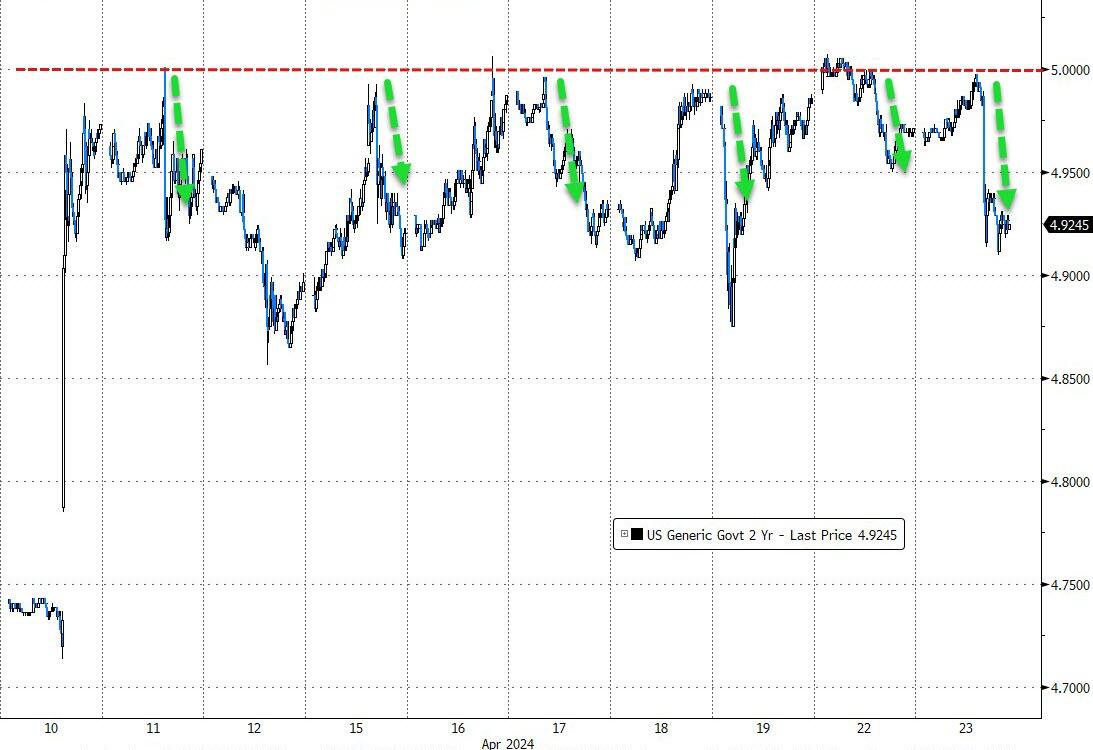
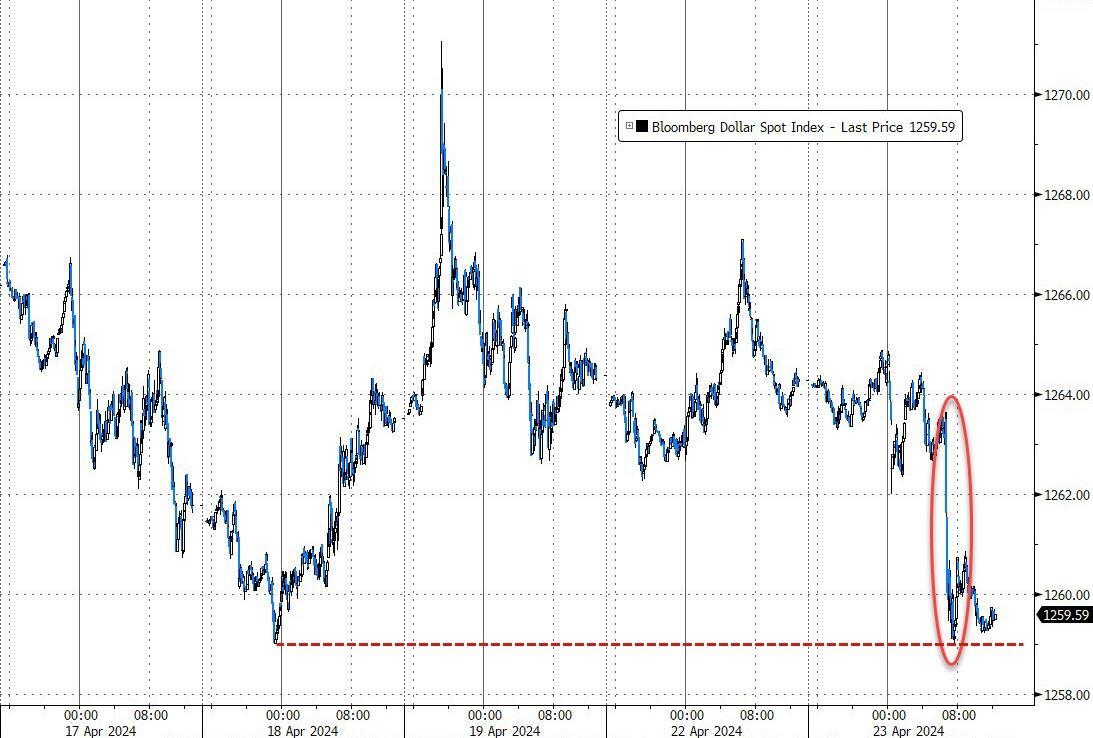
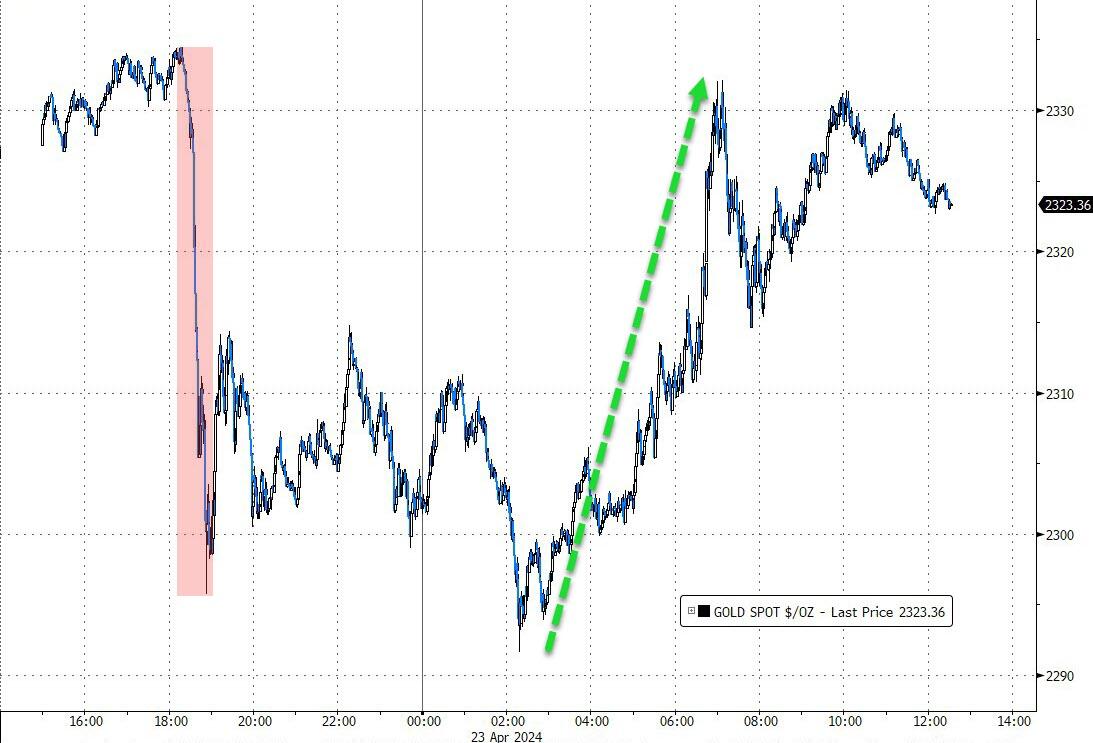
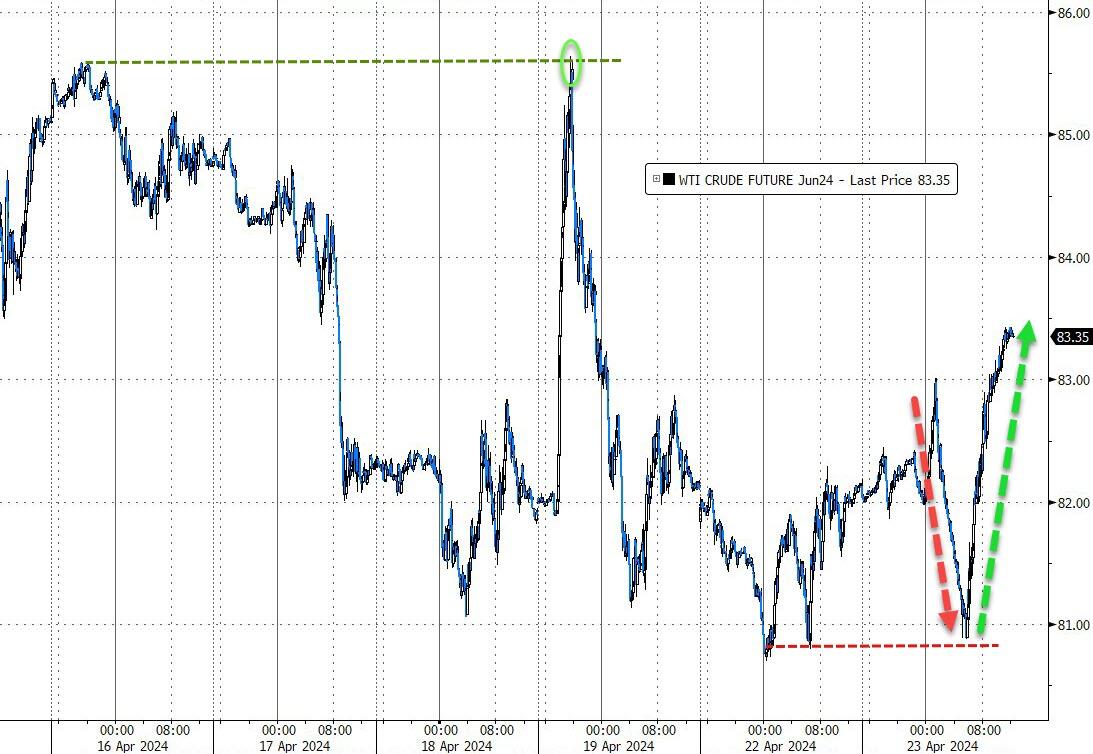
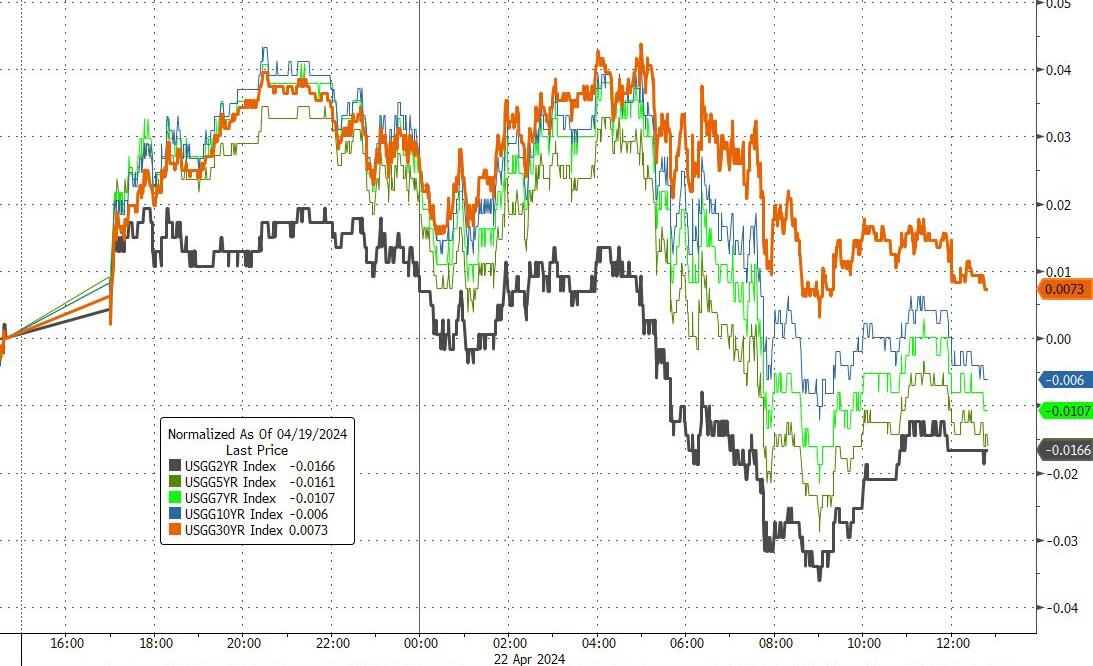
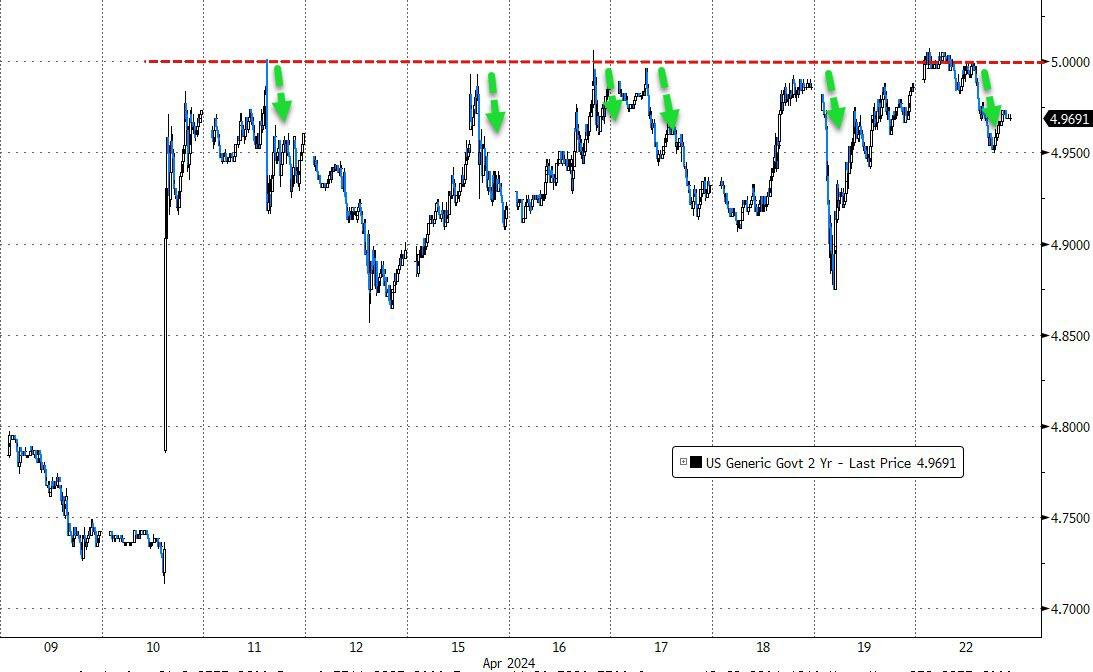
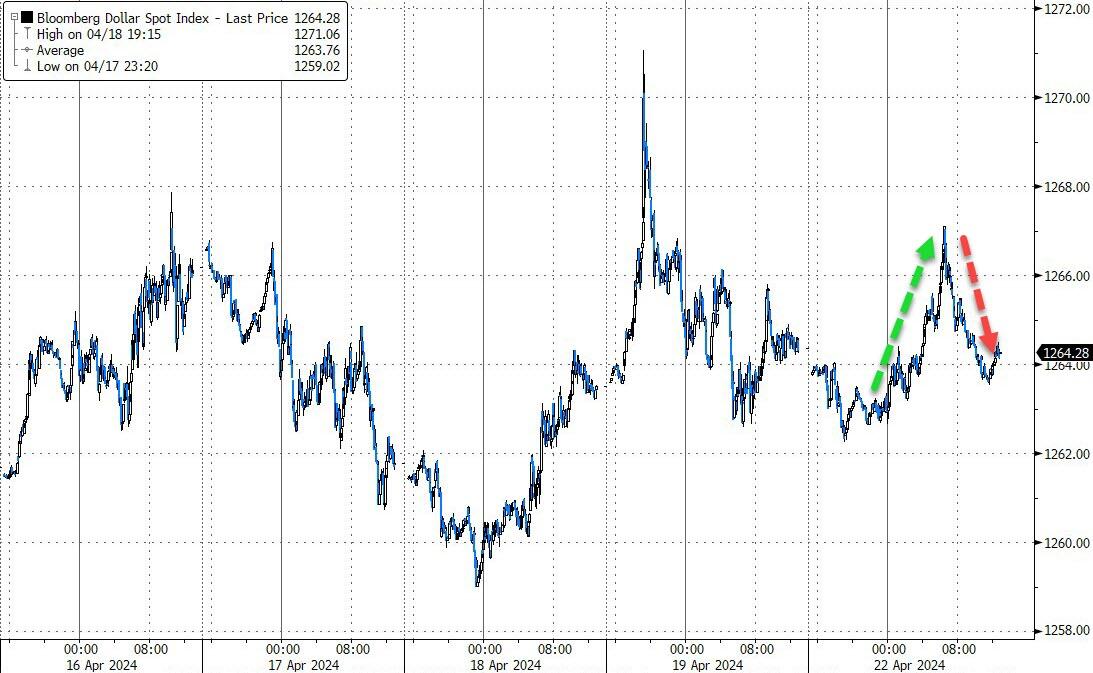
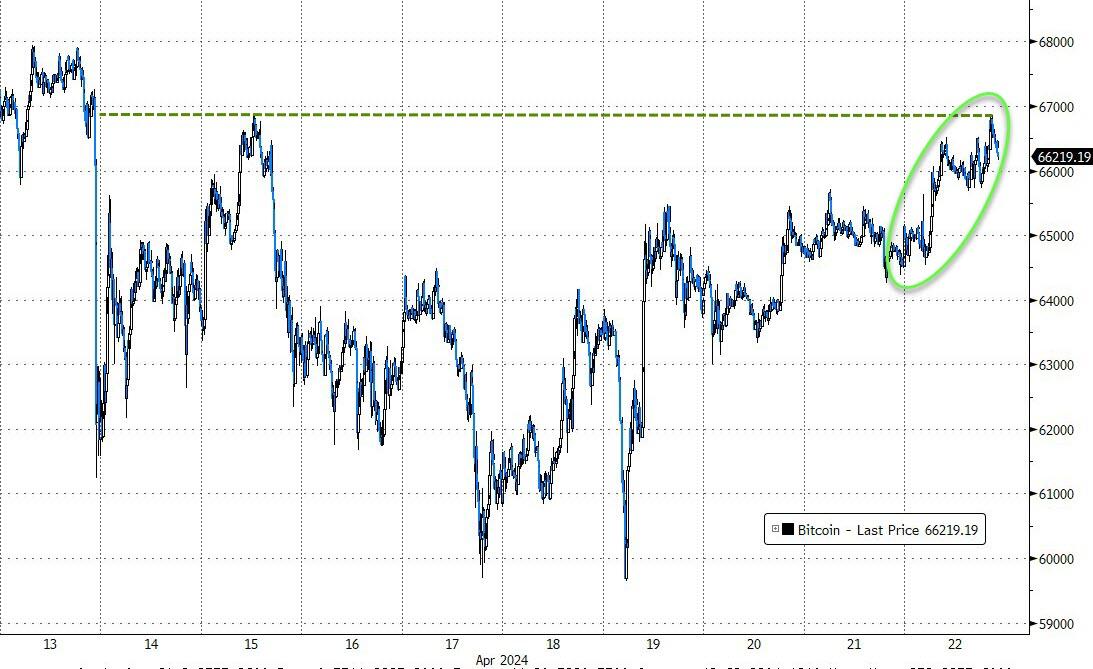
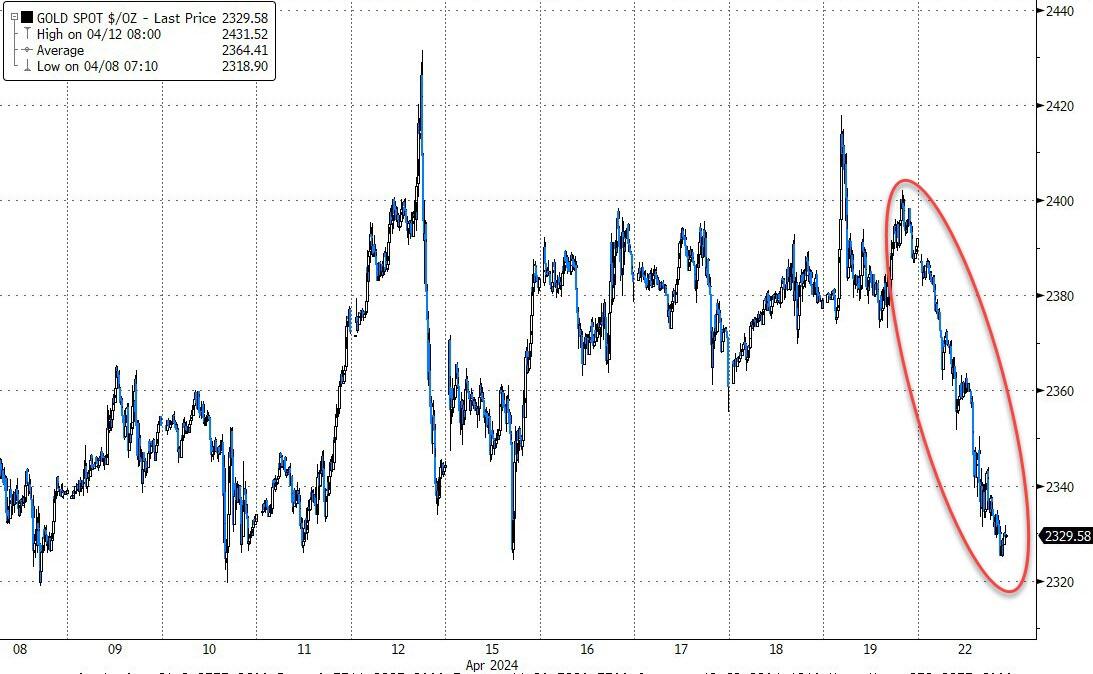
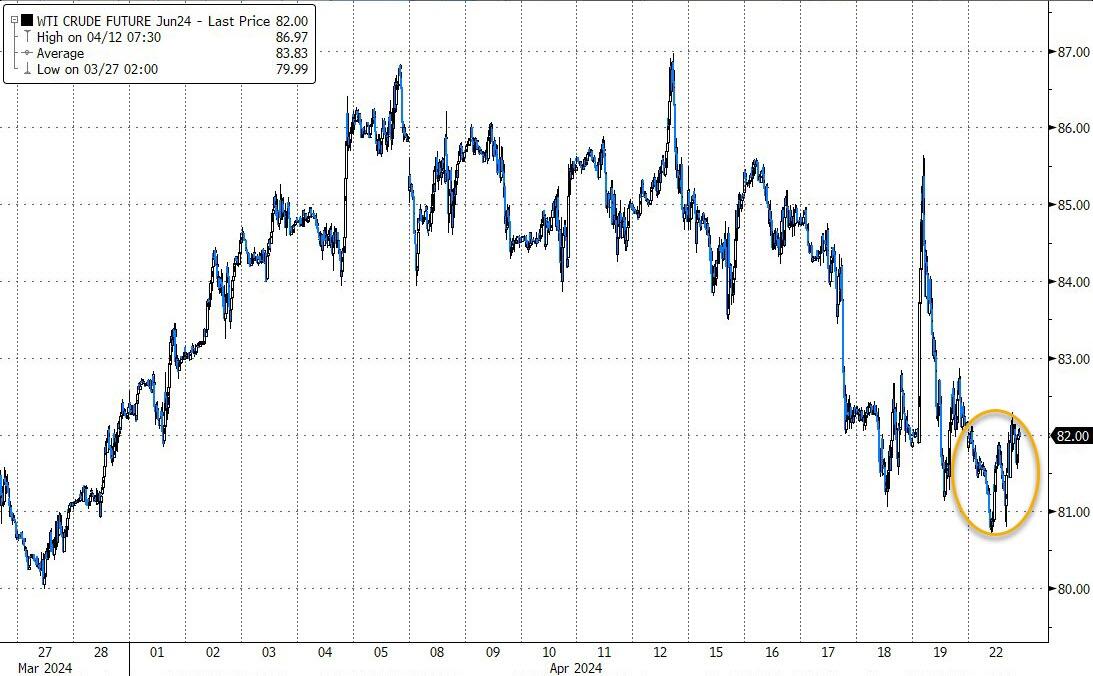
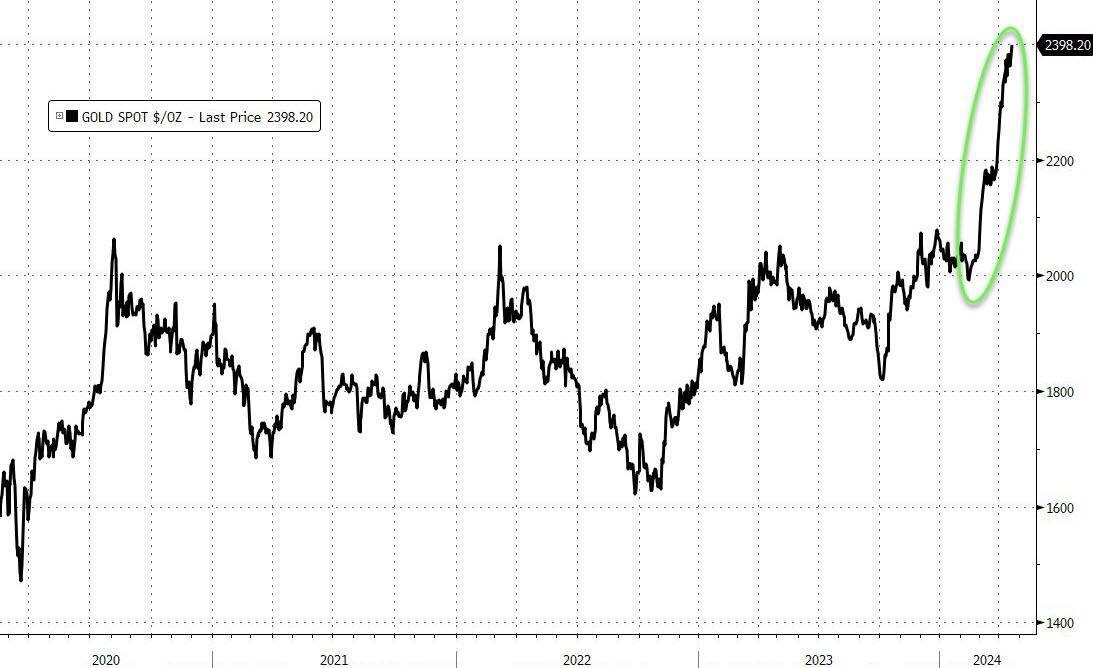
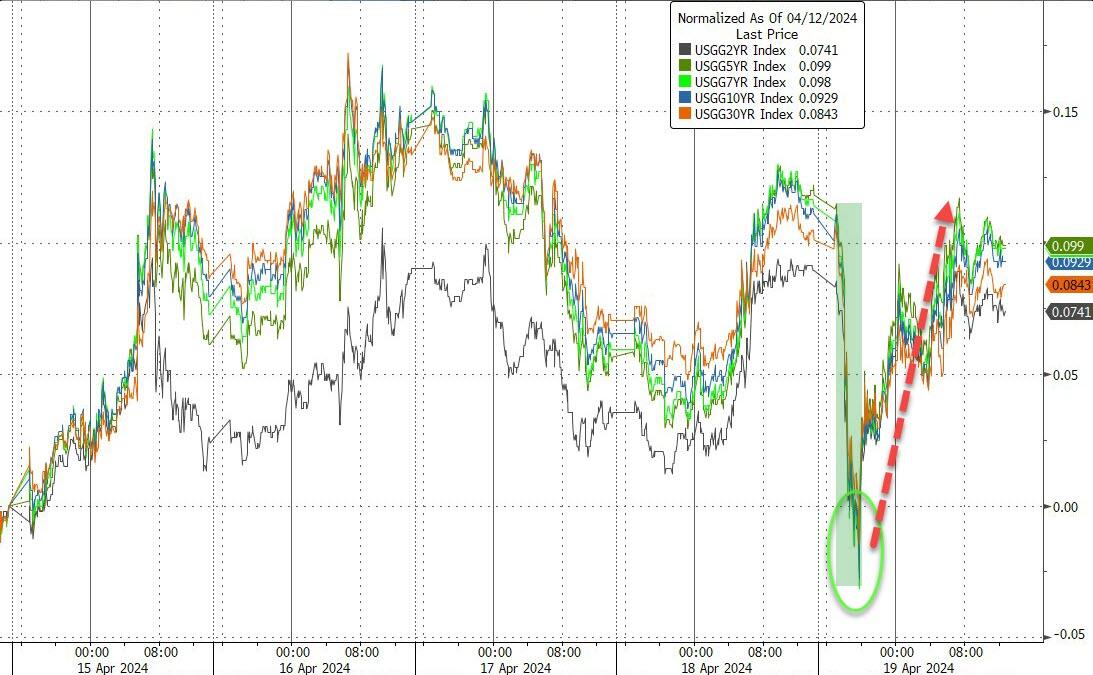
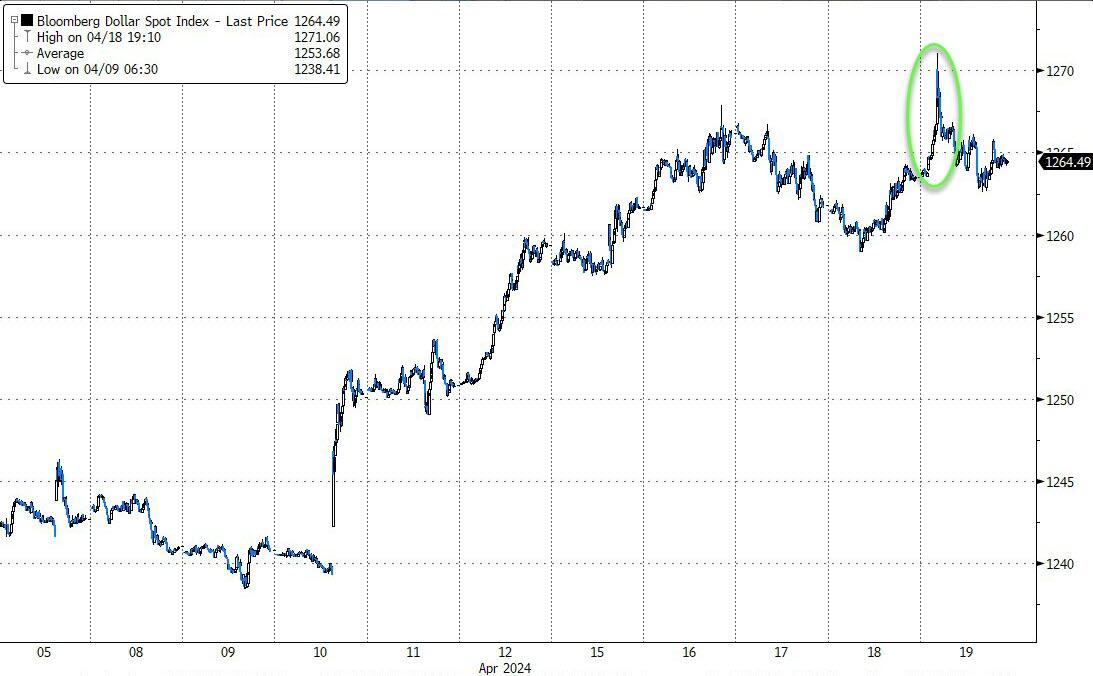
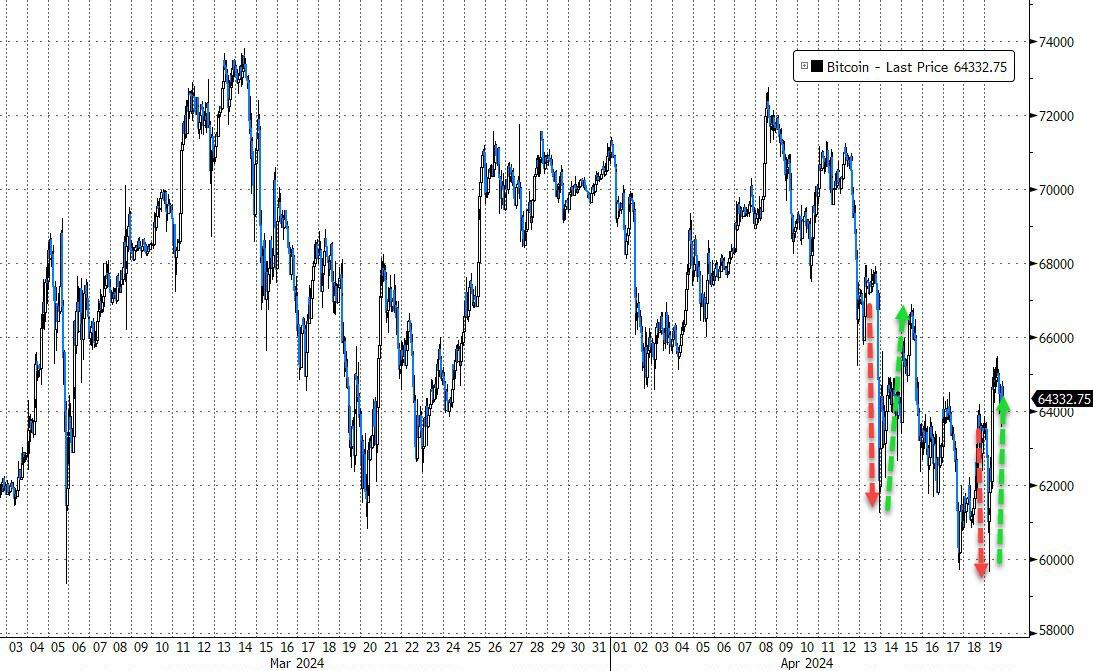
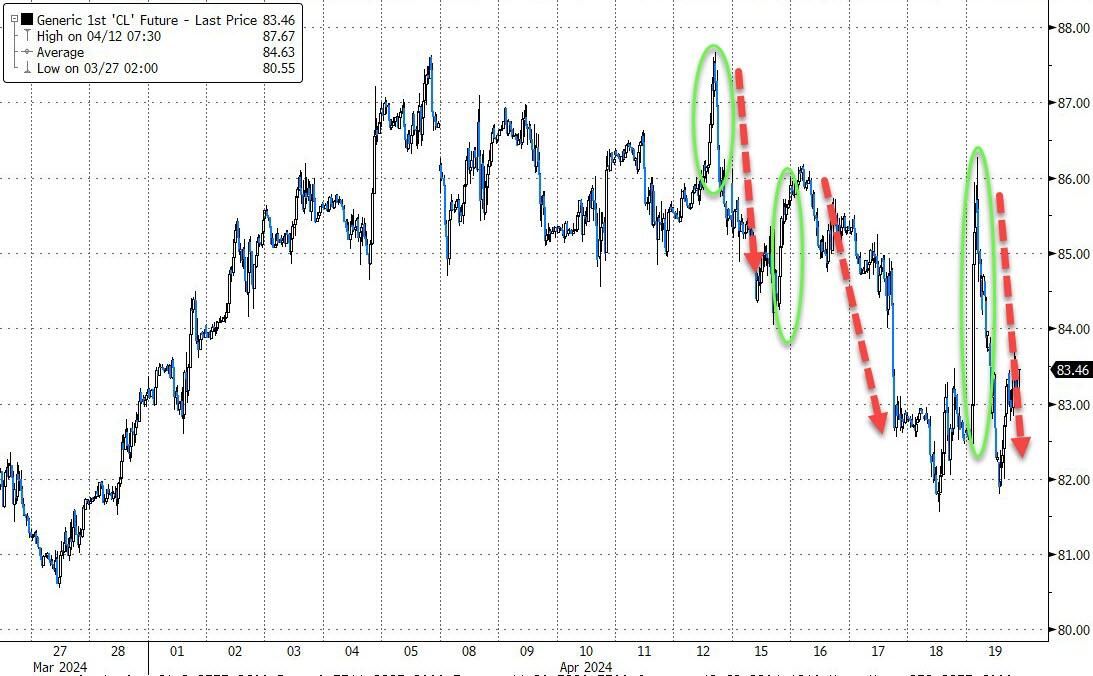
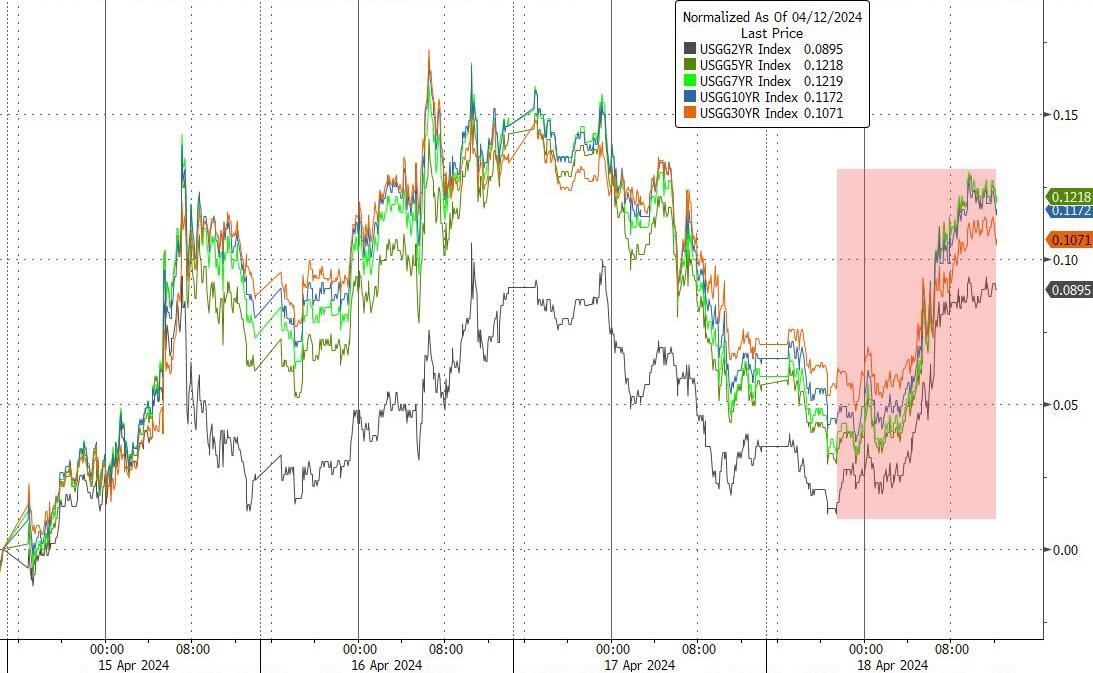
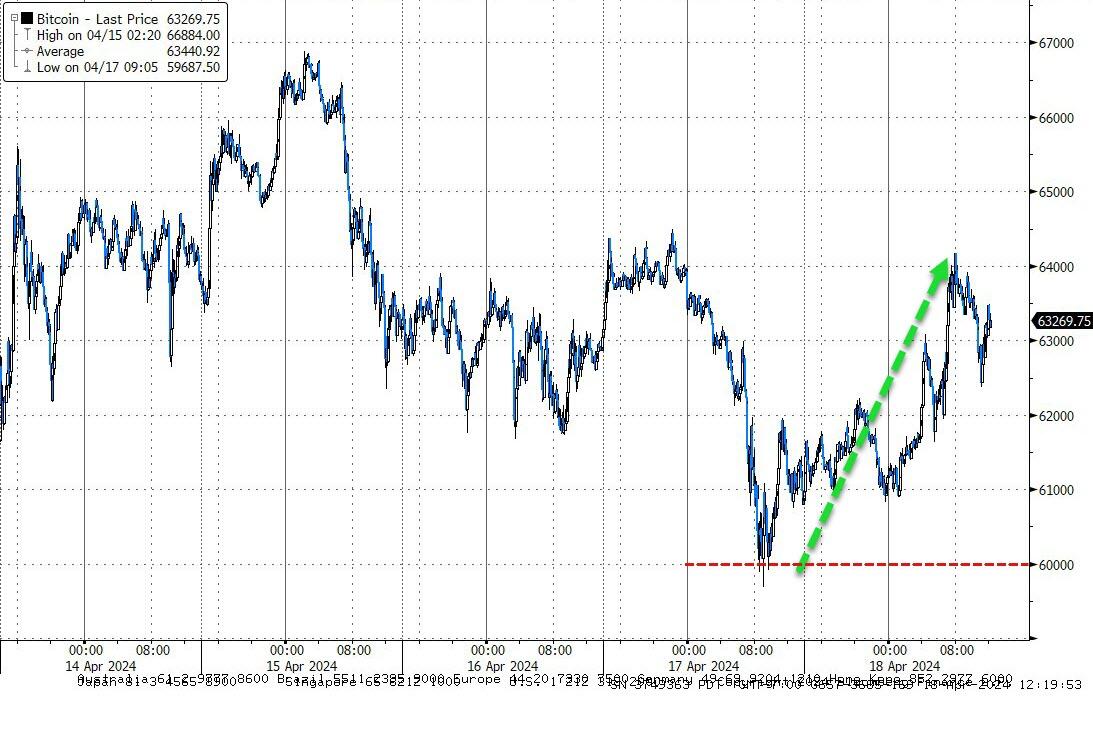
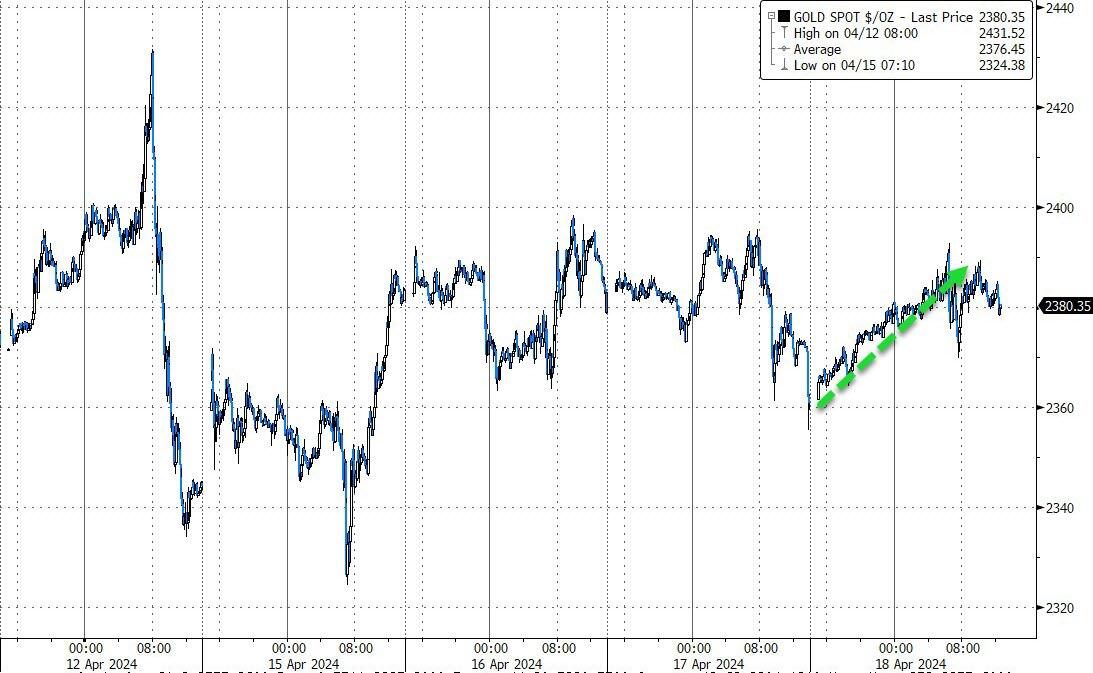
In the bond market, yields fluctuated, with the 2-year yield facing resistance at the 5% threshold. The currency market saw the dollar decline, while gold experienced a minor drop. Bitcoin maintained stability at around $67,000. In the commodities market, oil prices demonstrated resilience, forming a V-shaped recovery to close above $83.

As we await Tesla’s earnings report, will it contribute positively or negatively to the current market environment?

Read More

S&P 500 Rebounds: Is The Storm Over?

Ulli Uncategorized Contact

[Chart courtesy of MarketWatch.com]

In the ever-shifting landscape of the financial markets, the S&P 500 has managed to rip higher, finding stable ground after a tumultuous week. This resurgence was largely fueled by a rebound in tech shares and a de-escalation of tensions in the Middle East, with a notable short squeeze lending major support. As traders cast their gaze forward, the anticipation of major earnings releases hangs in the air, adding to the market’s buoyancy.

Simultaneously, U.S crude oil experienced a decline of more than 1% following Iran’s announcement that it would not escalate its conflict with Israel. This news brought a sigh of relief to investors who had been bracing for higher oil prices to contribute to inflation, potentially causing the Federal Reserve to pause on rate cuts—a move they are proceeding with regardless.

The market’s upward trajectory is set against the backdrop of a potentially significant week for earnings, particularly with the spotlight on the ‘Magnificent Seven’ tech companies. Nvidia, a favorite in the chipmaker and artificial intelligence sectors, saw over a 2% climb, recovering from last week’s nearly 14% selloff.

The improved tone in global stock markets can be attributed to two main dynamics: the decline in gold and oil prices, and the steadiness observed in the USD, rather than an increase. The fading concern over a potential regional war in the Middle East has likely contributed to the higher U.S. bond yields observed today.

As the week progresses, some potentially bigger news looms on the horizon. The GDP data due out on Thursday will offer insights into the economic trajectory, while a key inflation reading on Friday could shift perspectives significantly. The Commerce Department is set to report personal consumption expenditures price index data for March, with the PCE deflator being the Fed’s preferred inflation gauge.

In the bond market, yields were mixed with a tendency towards the lower end, as the 5% yield posed major resistance to the 2-year. The dollar experienced its own fluctuations but ultimately closed unchanged. Meanwhile, Bitcoin gained momentum over the weekend, moving towards the $67k mark.

Gold, which had been performing exceptionally well—rising for 13 out of the last 17 days and outperforming the S&P 500 by a considerable margin year-to-date—even after today’s sell-off, was ‘spanked’. Crude oil prices oscillated but ended the day unchanged as headlines of warmongering receded.

During these developments, one can’t help but wonder:

Is this period of relative calm merely the precursor to the next financial upheaval?

Read More

ETFs On The Cutline – Updated Through 04/19/2024

Ulli ETFs on the Cutline Contact

Do you want to know which ETFs are hot and which ones are not? Then you need my High-Volume ETF Cutline report. It tells you how close or far each of the 311 ETFs I follow is from its long-term trend line (39-week SMA). These are the ETFs that trade more than $5 million a day, so they are not some obscure funds that nobody cares about.

The report is split into two parts: The winners that are above their trend line (%M/A), and the losers that are below it. The yellow line is the line of shame that separates them. You can see how many ETFs are in each group and how they have changed since the last report (244 vs. 228 current).

Take a peek:

The HV ETF Master Cutline Report

If you are confused by some of the terms we use, don’t panic. I have a helpful Glossary of Terms for you.

If you want to learn more about the Cutline method and how it can make you rich (or at least less poor), read my original post here.

ETF Tracker Newsletter For April 19, 2024

Ulli Market Commentary Contact

ETF Tracker StatSheet          

You can view the latest version here.

PRECIOUS METALS SURGE: A HARBINGER FOR EQUITY MARKETS?

[Chart courtesy of MarketWatch.com]

  1. Moving the markets

Current economic forecasts suggest that the Federal Reserve may delay any rate reductions until September or later, with some analysts not ruling out the possibility of no cuts throughout the year.

Year-to-date analysis for 2024 reveals that while hard economic data has shown improvement, it has been overshadowed by a notable increase in inflation. This has led to a new all-time high for gold prices. Echoing this sentiment, Federal Reserve spokesperson Goolsbee emphasized the significance of the recent inflation data, suggesting that it cannot be overlooked after three consecutive months of similar trends.

Consequently, market expectations for rate cuts in 2024 and 2025 have diminished significantly this week. This shift in sentiment is clearly illustrated in the accompanying chart, hinting at the potential direction of future rate movements.

Ultimately, the Dow was the sole major index to achieve a gain, while its counterparts suffered losses. The MAG7 stocks also faced a setback, breaking below their 50-day moving averages, as the broader AI sector continued its decline without breaching its 2021 highs.

In the bond market, yields rose following an initial drop in response to the Israeli missile strikes. Meanwhile, the dollar experienced its second consecutive week of gains, Bitcoin exhibited volatility ahead of its halving event, and the 2-year yield once again failed to reach the 5% threshold.

Oil prices concluded the week lower, while gold maintained its strong performance, closing at yet another record high. Silver, too, gained momentum, increasing by 3% over the week to reach its highest point since February 2021.

With precious metals on the rise, one must wonder:

Are they signaling a wake-up call to the equity markets?

Read More

Weekly StatSheet For The ETF Tracker Newsletter – Updated Through 04/18/2024

Ulli ETF StatSheet Contact

ETF Data updated through Thursday, April 18, 2024

How to use this StatSheet:

  1. Out of the 1,800+ ETFs out there, I only pick the ones that trade over $5 million per day (HV ETFs), so you don’t get stuck with a lemon that nobody wants to buy or sell.
  1. Trend Tracking Indexes (TTIs)

These are the main indicators that tell you when to buy or sell Domestic and International ETFs (section 1 and 2). They do that by comparing their position to their long-term M/A (Moving Average). If they cross above, and stay there, it’s a green light to buy. If they fall below, and keep going, it’s a red light to sell. And to make sure you don’t lose your shirt if things go south, I also use a 12% trailing stop loss on all positions in these categories.

  1. All other investment areas don’t have a TTI and should be traded based on the position of each ETF relative to its own trend line (%M/A). That’s why I call them “Selective Buy.” In other words, if an ETF goes above its own trend line, you can buy it. But don’t forget to use a trailing sell stop of 12%, or less if you’re feeling nervous.

If some of these words sound like Greek to you, please check out the Glossary of Terms and new subscriber information in section 9.

  1. DOMESTIC EQUITY ETFs: BUY— since 11/21/2023

Click on chart to enlarge

This is our main compass, the Domestic Trend Tracking Index (TTI-green line in the above chart). It has broken above its long-term trend line (red) by +4.96% and is in “Buy” mode as posted.

Read More

Inflation Worries And Rate Hike Expectations: Wall Street’s Dilemma

Ulli Market Commentary Contact

[Chart courtesy of MarketWatch.com]

  1. Moving the markets

The S&P 500 index continued its downward trajectory, extending its losing streak to five consecutive days. Wall Street witnessed a seesaw battle between optimism and caution, resulting in a lackluster recovery attempt. Meanwhile, the Nasdaq faced headwinds, struggling with a 3% decline this week, marking its longest negative streak since December 2022.

Amidst this volatility, more than 12% of S&P 500-listed companies have reported earnings, showing promise for a positive season. Notably, 73% of these companies have exceeded Wall Street expectations. However, the second quarter has proven challenging due to mounting concerns about inflation and the Federal Reserve’s monetary policy.

As April unfolds, all three major indexes remain in the red, a stark contrast to the robust performance seen in the first quarter.

Bond yields surged, impacting equities, while Bitcoin and gold exhibit contrasting trends. The critical question remains:

Who will emerge victorious in this battle between rate hike expectations and the Nasdaq?

Read More