
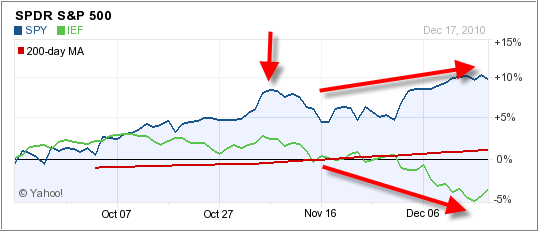
Ever since the Fed implemented the latest round of Quantitative Easing early in November, stocks and bonds have gone in different directions. The 3-months chart above shows the SPY (S&P; 500) vs. IEF, the 7-10 Year Treasury ETF.
Both hit their respective tops simultaneously (vertical arrow), after which bonds reversed direction and slid as interest rates rose. The stock market, as represented by the S&P; 500, dropped initially as well, but found some support and managed to maintain upward momentum although at a slower pace.
Nevertheless, despite having crept higher, stocks seem to have stalled even as economic numbers improved. The concern now is if interest rates continue to head higher at the pace of the past few weeks, stocks will be affected negatively.
We’ve seen emerging markets not only stall as well but come sharply off their highs made in early November. Some are now within striking distance of their trailing sell stops.
Based on reader emails over the weekend on the topic of sell stop percentages, here are the numbers again as I use them in my advisor practice:
For widely diversified domestic and international mutual funds and ETFs, I apply trailing sell stops of 7%. For more volatile sector and country ETFs, I use 10%—both are soft sell stops. That simply means that they are based on closing prices only and not intra-day market activity.
Comments 4
Hi Ulli,
The real diversion in your chart seems to have occurred even more recently, late november. Any idea what could have been the trigger?
Chris,
I still think it's part of the unintended consequences of the Fed action.
Ulli…
Ulli,
Looks like the ETF symbol TBF might be a good choice when interest rates really start to rise, not just one time, but when there is a clear trend. What do you think?
Trendman
TM,
Yes, that would be a good choice, but it's still too early.
Ulli…