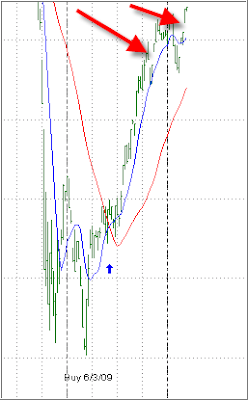
 In “Glass Ceiling Still Intact” I talked about the closing of the exhaustion gaps on the domestic TTI (Trend Tracking Index), and that the 1,100 level on the S&P; 500 was the resistance level at the time.
While the market seems to have broken out above the 1,100 level, it had not done so in convincing fashion.
Recently, strong buying emerged causing a gap opening (actually two) on the weekly domestic TTI chart as shown above (right red arrow).
Gap openings occur when strong buying pushes the opening price above the closing price of the prior week creating a gap in the chart.
As previously discussed, while this shows strong upward momentum, it also means that prices will retreat at some point to “close the gap.” The timing of it, however, is the big unknown.
Take a look at the above chart again and note the left arrow, which shows the breakaway gap established during the last quarter of 2009. It was finally closed when prices retreated during the 1st quarter of 2010 before resuming their upward trend.
When the closing of a gap occurs, the market is at a crossroads. It could turn around and head higher again as it did in the above example or, further weakness could set in resulting in a long-term trend change.
If you decide to use the closing of a gap as an entry point to “buy on a dip,” be sure to have your sell stops in place in case the dip does not hold, and you end up in a bearish downdraft.

Comments 3
Uli;
I know you don't concern yourself with technical analysis but the RSI indicator for US equity ETFs are mostly in the 70's while the short US equity ETFs are in the mid 20's. This sure indicates a drop in US equity ETF prices very soon, some divergence was seen on Friday.
Frank
Frank,
I agree with you, except the timing if the big unknown since the RSI can stay at the 70 level for a long time.
Ulli…
As I understand RSI, Ulli's right; RSI can stay at the 70 level for a long time. Also, it's my understanding that RSI signals overbought, when it starts to APPROACH 70, which was around the end of February or the first part of March. As we are seeing there hasn't been any significant overbought sign, unless Friday was the beginning, so who knows when we'll see a real downtrend, as RSI is only one indicator, and all indicators are fallible. That's why it's good to look at several indicators, and even then, no matter what the indicators show, there's no magic formula for knowing the timing of the market, otherwise all of the market analysts would be retired billionaires or making fortunes advising others how to make billions on Bloomberg and the other networks hawking their advice through overpriced motivational seminars, interviews unreliable newsletters, unlike Ulli's free and reliable newsletter.