A convenient and efficient way to track sell stops has been on many readers’ minds. Tom had this to say:
How can I get a fund or ETF price automatically downloaded into my personal investment spreadsheet?
Setting sell stops based on new highs, etc. requires finding the price and manually entering it in the spreadsheet everyday. When I don”t look every day, I know I miss something.
Is this possible without subscribing to some high priced electronic quote system, etc.? (Free is good!) It seems with the tracking you do, there must be an obvious way to do this that I overlook.
I have Schwab and Fidelity, but I have not found a way to do this from their websites. There must be some software, program, or website that will pick up this info and put it into a spread sheet on your PC.
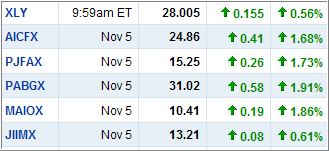
For many years, I have used a simple way to get that task accomplished. I have set up “My Yahoo” as a personalized page to track daily news events. Part of that set up includes a listing of funds/ETfs that I currently own and follow on a daily basis.
The funds/ETFs are listed by ticker, date, price and change for the day as the table above shows. It also includes a feature that lets you export this list to a spreadsheet, neatly arranged in columns to be copied and pasted wherever you like.
In your spreadsheet, you could use Tab1 to paste in all data, as I do, and use Tab2 to have your current holdings listed and formatted. By linking the prices in Tab1 to Tab2, you only need to go though one copy and paste process and your holdings are instantly updated.
Afterwards, I simply view my column titled high price to see if it needs updating, which I do manually. This obviously only comes into play during a market rally when new highs have been made.
Here’s what my matrix looks like using an actual purchase and a sell stop that got triggered:
[Double click to enlarge]
The columns are pretty self explanatory. The “High” column needs to be updated when prices make new highs, while the “Action” column is programmed to alert me to any changes in the status. In other words, when the 7% sell stop level has been broken, the “Hold” switches to “Sell,” giving me an easy identifiable alert when looking at a large list of items.
While I use other custom data bases to track these sell stops for a large number of funds/ETFs, this spreadsheet along Yahoo’s export feature is simple and effective and requires minimum time on your part once it is set up.

Comments 9
A related question. You replied to my query before regarding – after stoploss has triggered and fund position has been exited, when does one get back into the fund if market turns upward. Your answer was when it makes back the high. Makes sense. Now, the question is do we go back into the SAME fund OR another fund that is doing "better" according to your weekly PDFs? And if a different fund, then do we wait it TILL makes back ITS high?
As far as the price of commissions, I have learned that they are not as as important as setting and following a stop loss. Unless you are trading very often and/or in large volume, don't get hung up the price of commissions, whether it is $7 or $12.
Vintage,
You are correct; that's the approach I use.
Ulli…
Ulli,
I like your idea of copying prices from Yahoo web site, however I cannot figure out how to just copy the column of prices. Copy function on my PC copies entire table of info (Symbol, Price, Change & % Change). I already have symbol and I do not need Change & % Change in sell spreadsheet. Then when I past into excel, all of the data for a fund pasts in 1 cell rather than 4. Any words of wisdom on your procedure?
Bob
Bob,
As I said, you don't copy prices, you use the "export to spreadsheet function" that Yahoo offers.
Ulli…
Ulli,
I found an add-in for Excel that is easily installed and used to download last price for any security of fund from MSN. Go to link below to see description & how to download. Sure is making my life easier and will make it easier for my daughter to take over process when I cannot.
http://www.vertex42.com/ExcelTemplates/excel-stock-quotes.html
Bob T
What I do is use google spreadsheets. This had a built in function GoogleFinance("symbol";"attribute") which will pull in the "attribute" (example : price) for the symbol.
Works like a charm.
Just reviewed this today. Thanks. Right on target. I'll try Yahoo and also check out the MSN method and Google Spreadsheets.
From the article: "Afterwards, I simply view my column titled high to see if it needs updating, which I do manually. This obviously only comes into play during a market rally when new highs have been made."
You can automate this in Excel as follows. In the relevant cell of the High column, enter an equation like this:
=IF((E5<=C5),C5,E5)
where E is the High column and C is the Current Price column. This equation says "update this (High) cell if its value is less than or equal to the corresponding Current Price cell.
This is a circular reference which Excel normally does not like. Click on Tools-Options and select the Calculations tab. Check the Iterations box and set the maximum number of iterations to 1. Then put a low starting value in the High cell to start the process. The High value will now be automatically raised each time the Current Price exceeds it.