My latest No Load Fund/ETF Tracker has been posted at:
http://www.successful-investment.com/newsletter-archive.php
Despite a sharp sell off on Monday, the major averages recovered and closed higher for the 4th week in a row.
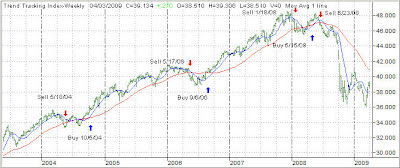
Our Trend Tracking Index (TTI) for domestic funds/ETFs remains below its trend line (red) by -4.08% thereby confirming the current bear market trend. 
The international index now remains -8.14% below its own trend line, keeping us on the sidelines. 
For more details, and the latest market commentary, as well as the updated No load Fund/ETF StatSheet, please see the above link.

Comments 2
Ulli,
check this fastmoney.com april 2 clip out with chartist Carter Worth. He portends a definition of bottoms with the 150 day avg. This is the url: http://www.cnbc.com/id/15840232?video=1081123426&play;=1
Weekly results of my implementation of the SimpleHedge strategy are viewable here.
In addition to my actual hedge composition I have added three additional ledgers, all hypothetical scenarios.
After reading the question posted last week by StarBright I decided to put the idea of hedging mid-cap longs and mid-cap short to the test. Using basis prices based upon the same date as in my actual hedge I have titled this table “SP MC400 Hedge” and it is the second table on the page. For the calculations it uses ETF MYY (S&P; MidCap 400 short) and the actual S&P; MidCap 400 index rather than SH and the S&P; 500.
I have published also two additional hypothetical scenarios to the page just for the sake of research. The third table consists of purely large cap mutual funds that met all of the criteria outlined in my post last Friday and were found on the StatSheet while the fourth table is also large cap oriented, this time using only ETFs for the positions.
A mere one week into the hedge I have learned the following:
My fund selections, while being advertised as roughly 1.2 beta funds for the last three years on the Yahoo web site, have shown the propensity to make incredibly large moves regardless of whether you measure them against the S&P; 500 or the S&P; 400.
For the week the daily average beta for SH and MYY where 1.0 and .98 respectively. However, for the week the daily average beta for ARGFX and FLCGX were 1.8 and 1.7 respectively. These funds have made 5% and 6% moves in either direction!
In all honesty, if I’d have known that these funds would show this kind of behavior, I likely would have rejected them in favor of less volatile funds simply because dramatic moves like this test my risk profile tolerance.
However, based upon the short time frame for which results are available it seems to me that despite these sometimes gut-wrenching daily movements, overall the hedge strategy and composition would seem to be achieving reasonably acceptable results. And without fear of sharp declines that would severely trim traditional net long portfolios.
Ordinarily I would cringe at the idea of 5-6% moves in a position I owned, especially when the S&P; 500 is moving at most 2.5-3.5%. I believe that this week I learned first hand exactly what Ulli was designing this hedge for. By looking only at the “net hedge” position up or down, you gain some measure of control over these grand percentage movements that are commonplace today.
Other readers may have spotted this right off but in my case it helped tremendously to see it and feel it first hand.
I would be very interested to hear other reader’s results compared to mine and for those who are outperforming mine what are the criteria you used to screen your fund/ETF selections.
G.H.