 Sometimes it pays to look at the big picture to see where we have been, where we might be going and what has changed.
Doing that will at the same time also answer a frequently asked question, namely how much time does the domestic Trend Tracking Index (TTI) spend in bullish vs. bearish territory. As you know, for me, the dividing line between being bullish and bearish is the 39-week moving average of the TTI.
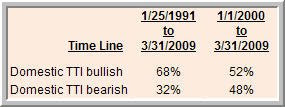
Looking back some 18 years, from 1/25/91 to 3/31/09, it turns out that the price line hovers above the trend line 68% of the time, while we spent 32% below it. That means, just about 2/3 of the time, the bulls were in charge.
But that does not tell the entire story. This period included the 90s, during which, for the most part, you could have thrown darts at the mutual funds pages of your daily newspaper and picked a winner.
Times have clearly changed since we moved into this century and with it the ratio of bullish to bearish periods. Take a look at the table above and note that from 1/1/2000 to 3/31/2009, we have only remained in the bullish zone 52% of the time vs. 48% in bear territory.
My guess is that by the time this current bear market is over, the ratio may have even turned further in favor of the bears.
This century has surprised us with 2 bear markets which, as a result, have caused the S&P; 500 to lose 42% from 12/31/1999 to 3/31/2009 with many portfolios following a similar descent. If this pattern continues and, investors along with advisors don’t adjust from creating only bullish portfolio scenarios, the consequences obviously will be dire.
Why bring it up?
For one, we are now spending more time on the sidelines since the bullish periods have been reduced from 68% to 52%, at least during the past 9 years. This ratio change would be even more extreme if I were to compare the 1990s to the 2000s.
While being on the sideline has been very rewarding in sidestepping the bear markets of 2000 and 2008, it has also made me look for alternatives to increase investment opportunities by using new products, some of which have only been available for a couple of years.
I am talking about ETFs, of course, and the more recent introduction of inverse products. They have led to the introduction of my SimpleHedge Strategy, which offers possibilities during the 48% of the time when the bears have the upper hand. I have recently expanded on these ideas further by testing successful hedges using China, the Emerging Markets and the BRIC countries. I will publish those results in due time.
To be clear, these additions do not mean that the basic premise of trend tracking has changed. Our goal still remains to track the major up trends and be invested in these bullish phases when the opportunities present themselves. On the other side, it is just as important that we continue to follow our sell stop discipline and be out of the market to avoid getting caught in severe bear market slides.
In the past 6 months alone, we have seen a rally of 20%, a subsequent drop of 24% and a rally again of some 26%, which are clear signs of violent bear market behavior and uncertainty as to the longer term direction. Those, who participated in all three scenarios have not made much headway in terms of portfolio gains but had to endure major emotional stress tests.
The battle of wits between bulls and bears will go on forever, and we have no control over it. What we do have control over is our investment approach, and I believe that the addition of the various hedge strategies will allow us to better deal with the ever changing market conditions.
