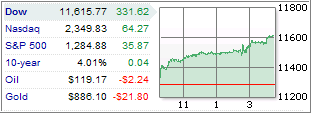
 The bulls partied and enjoyed a swig from the punch bowl after oil prices broke below $120/barrel and the Fed, as expected, left interest rates unchanged. Bargain hunters stepped in doing some buying while short-covering helped the bullish cause.
It’s not secret that the Fed is stuck between a rock and a hard place. Yesterday, they chose boosting the economy by not touching interest rates as opposed to raising rates to contain inflationary pressures from higher energy and food costs as well as support the ever sagging dollar.
While the rally seemed impressive, it did not change the underlying fact the trend is still stuck in bear market mode. Our Trend Tracking Indexes (TTIs) are now positioned as follows:
Domestic TTI: -2.51%
International TTI: -7.32%
It was definitely a feel good day for the bullish crowd and several newsletter readers emailed telling me that they had taken the up day to unload some mutual fund positions they neglected to sell when our last signal was generated on 6/23/08.
We need to see a lot more upside movement and a break above the long-term trend line before we can declare this to be a new bull market. Until then, this is nothing more than a bear market bounce.

Comments 3
Ulli:
Many thanks for your excellent posts. Two questions:
1.I would like to use the 200 day MA graph in finance.yahoo.com. A mutual fund like Eurox, which distributes dividends and capital gains some time in December of each year. The share prices drop after the dividend is distributed. How do I account for it in calculating the 200 day ma. Does finance.yahoo.com do it automatically? Or do you recommend using another web site?
2. As an individual investor, is it okay to monitor our portfolio once a week after we receive your weekly news letter? Or is it better to check the 200 day MA every day and take action. Please help. Doing it every day for each of my holdings appears tedious.
Thanks fo your time.
1. No, you can’t assume that the charts are correct. I have found that sometimes they are and sometimes they are not. To be accurate, you need to track the closing prices on a spreadsheet and make adjustments for dividends and splits.
2. No, you only need to adjust the moving average once a week as I do based on Friday’s closing price. During the week, you can follow the daily prices and see if they drop below the M/A, which would generate a sell signal.
Ulli…
Ulli: Many thanks for your always prompt replies.