

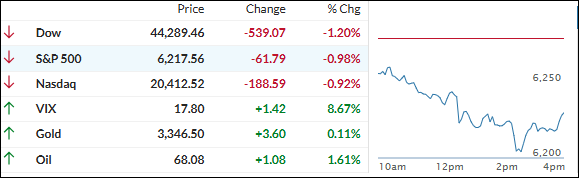
- Moving the market
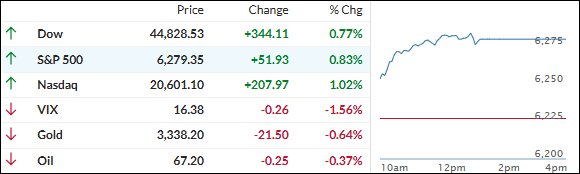
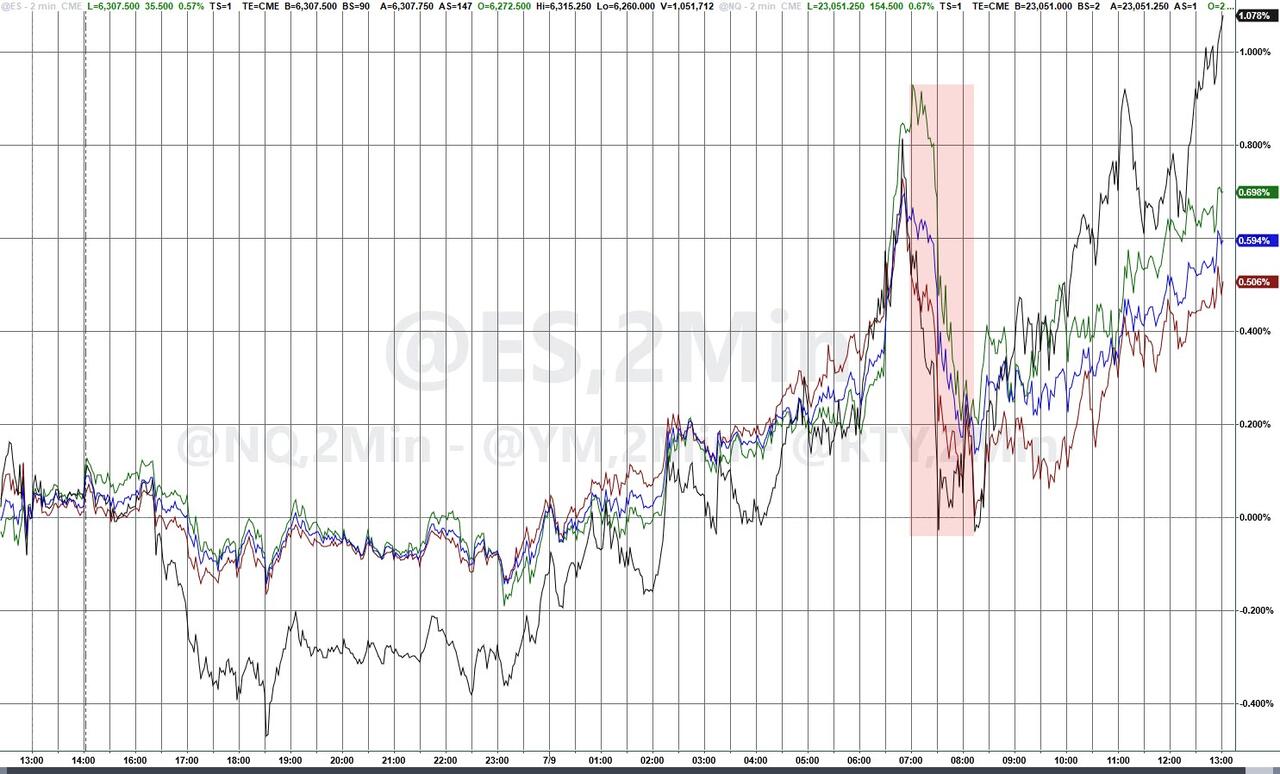
Tech stocks took the lead today, helping the market bounce back after the Dow’s two-day slide.
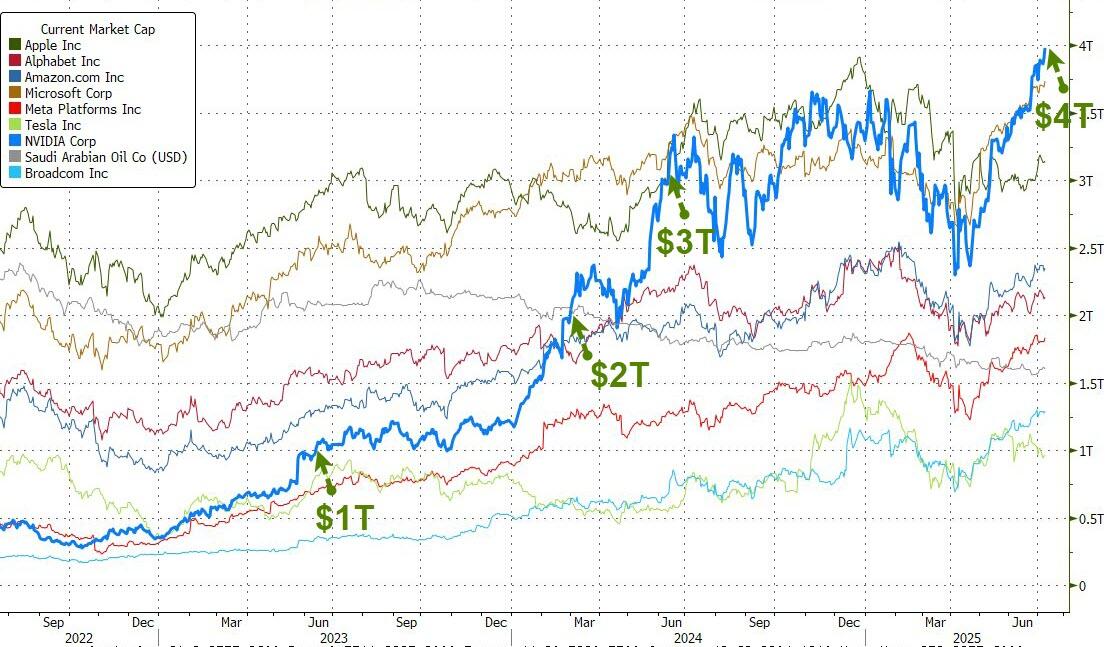
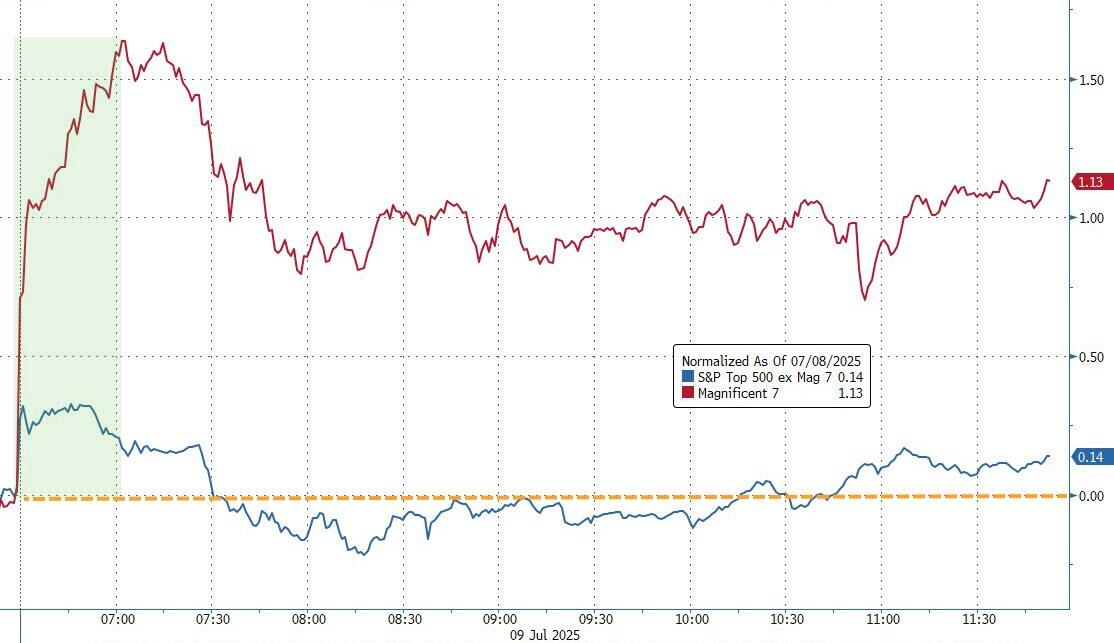
Nvidia stole the spotlight—not just for its 2% gain, but for becoming the first company ever to hit a $4 trillion market cap. That’s a milestone worth pausing for.
Other big tech names like Meta, Microsoft, and Alphabet joined the rally, riding the renewed wave of excitement around AI. Meanwhile, traders mostly shrugged off the latest tariff chatter.
The Fed minutes were the day’s main event, but they didn’t offer much clarity—just more of the same uncertainty.
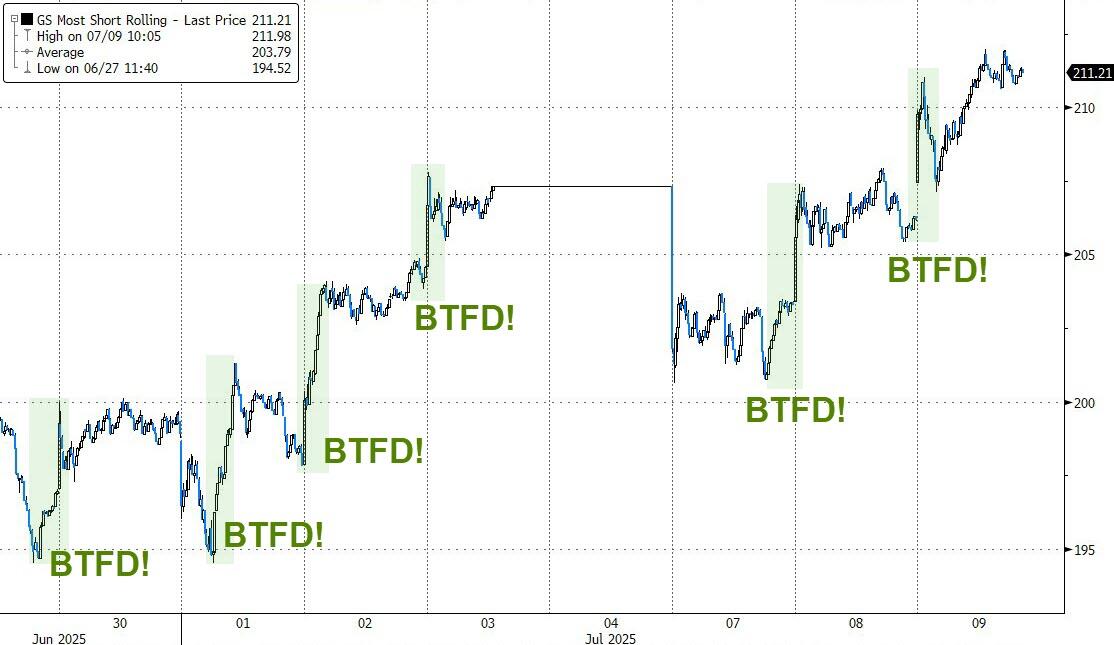
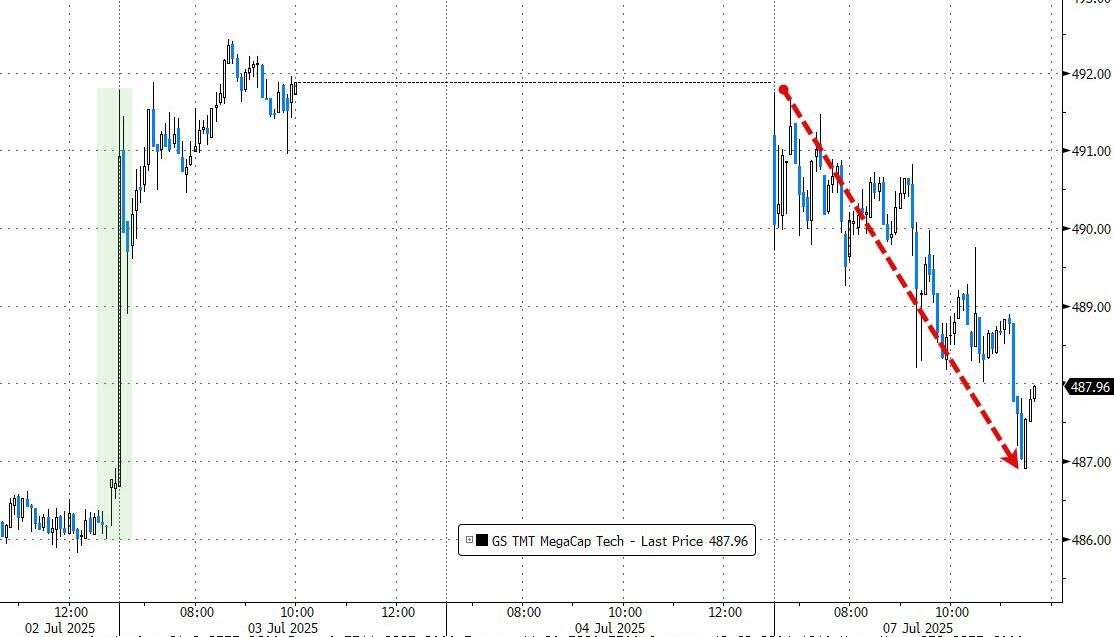
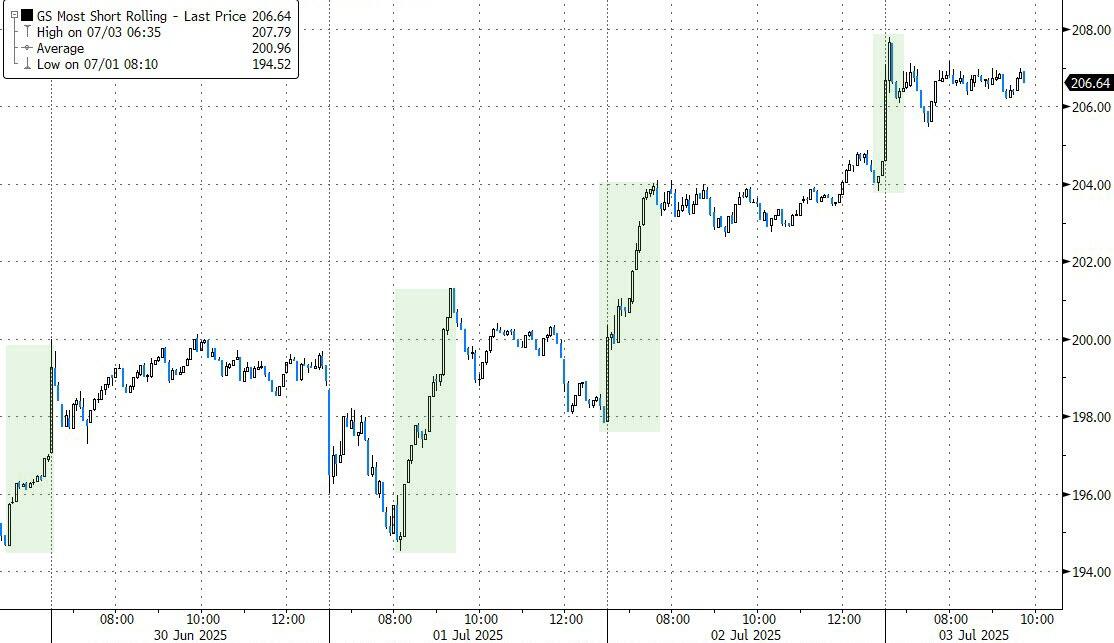
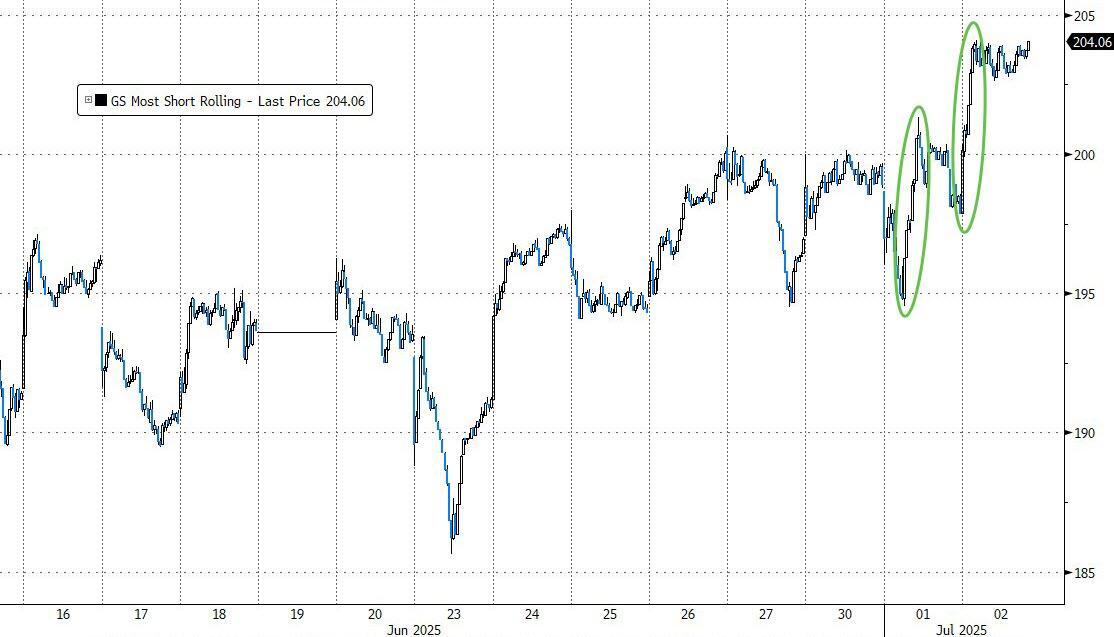
Still, the market found its footing after a midday dip sparked by Trump’s new round of tariff letters. Dip buyers jumped in quickly, especially in the Mag7 names, where a short squeeze added some extra fuel.
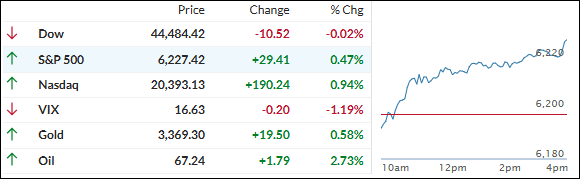
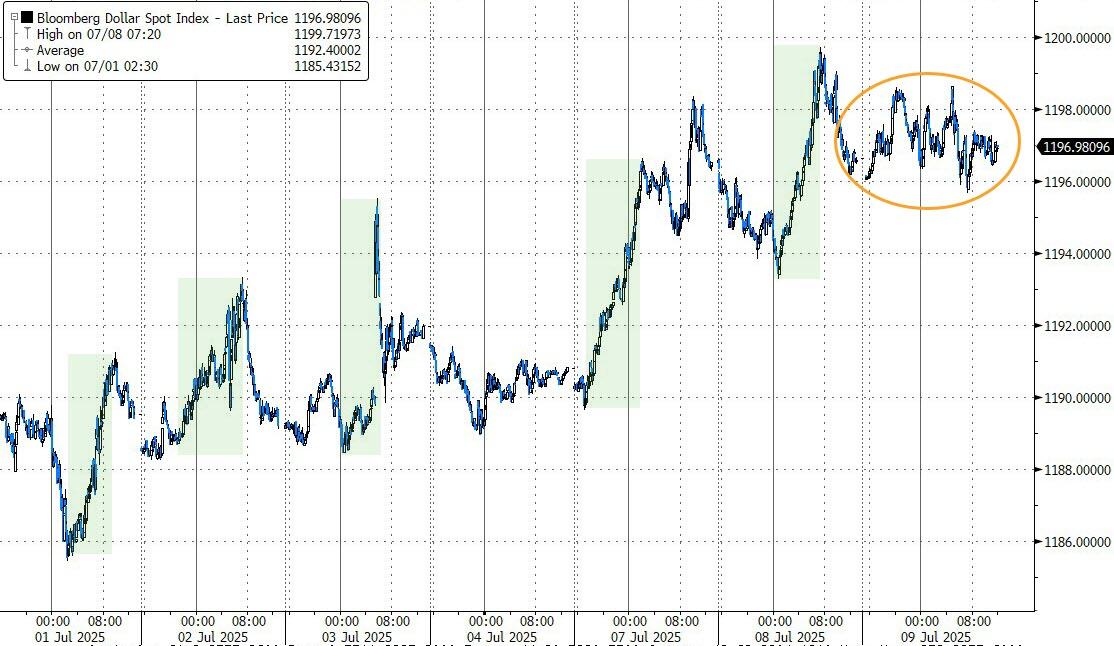
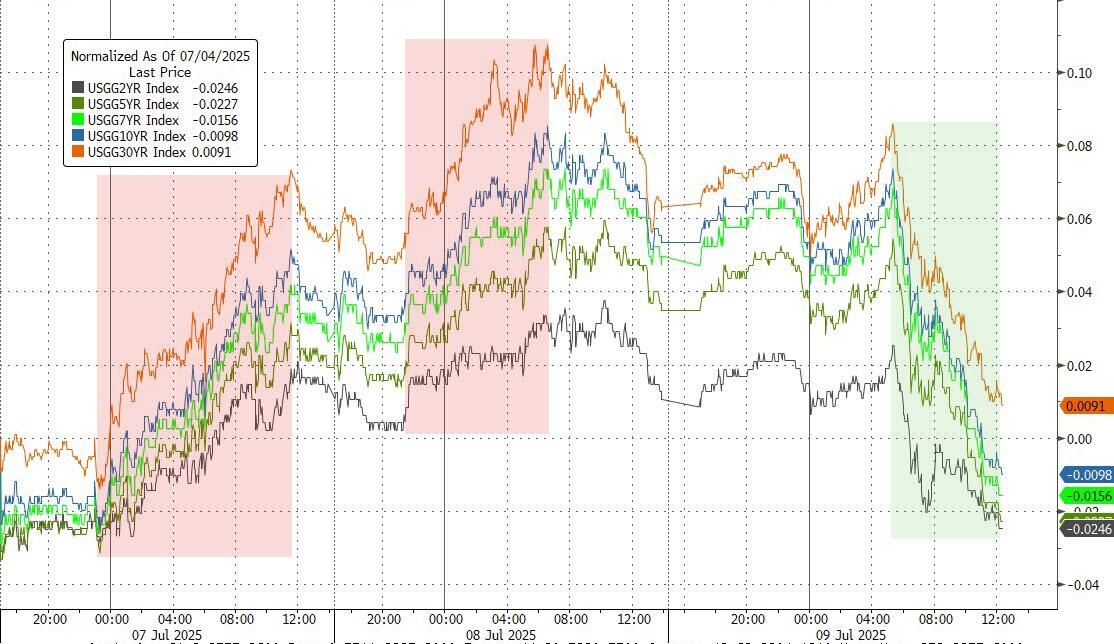
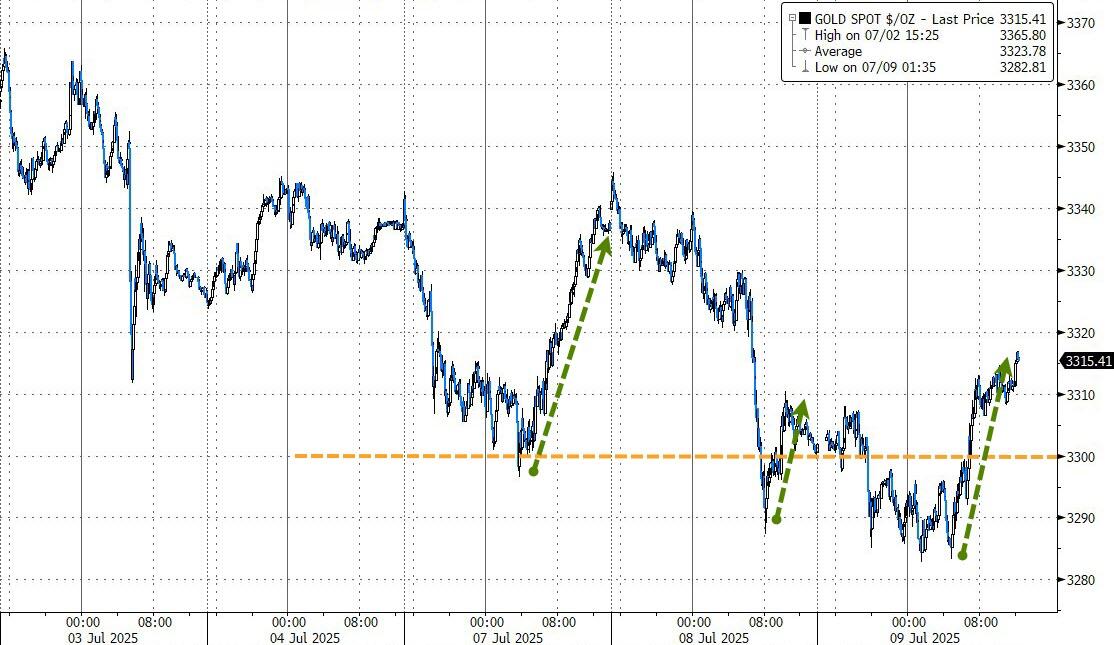
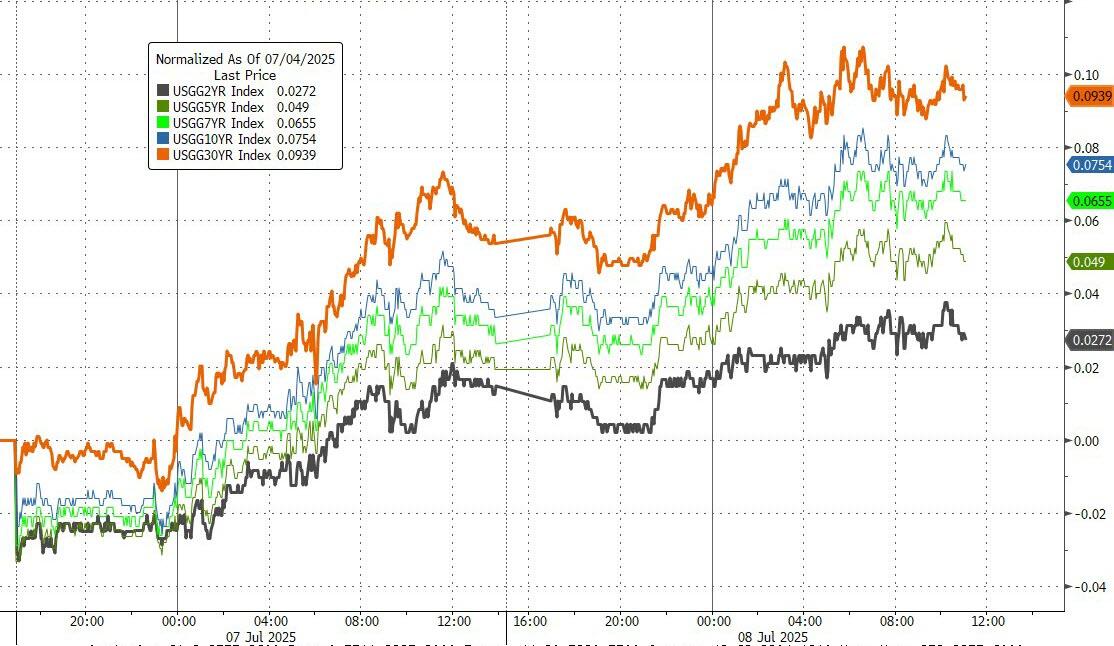
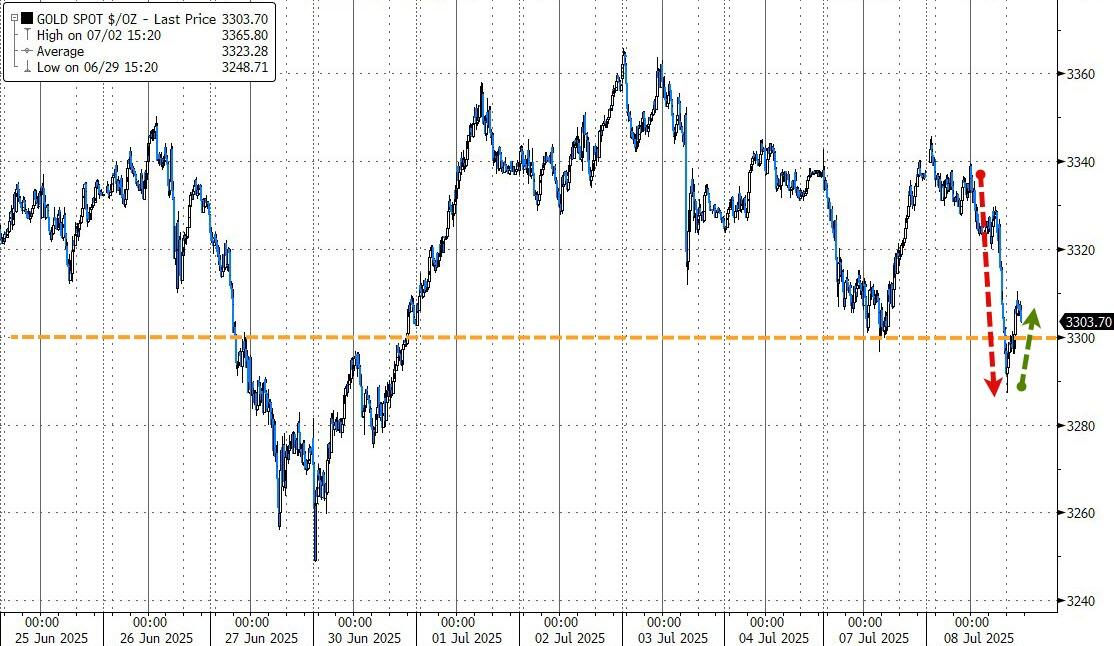
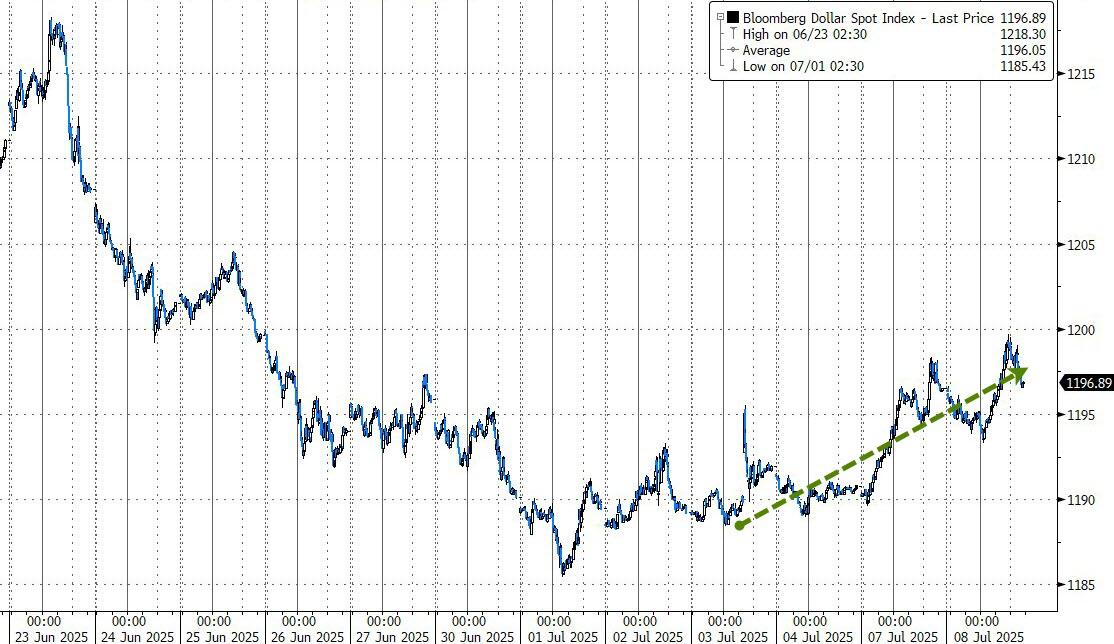
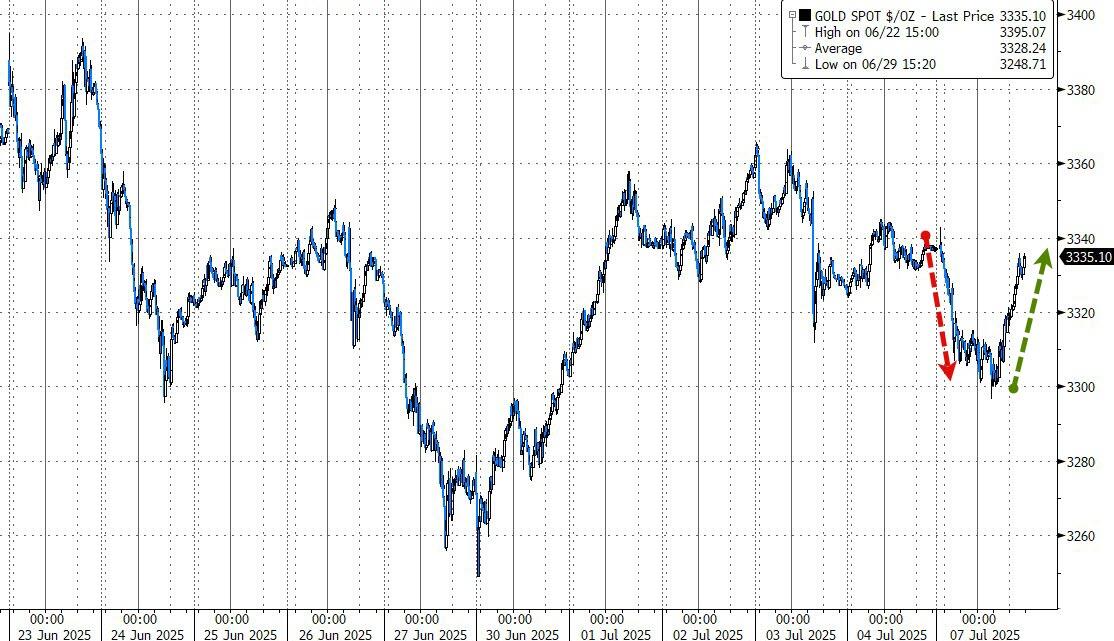
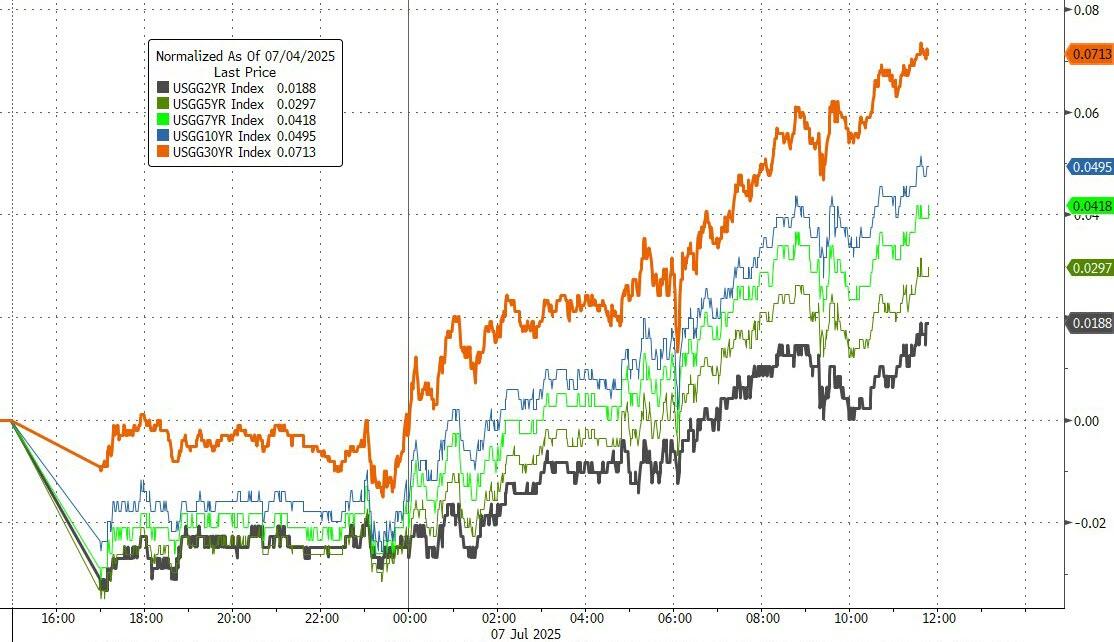
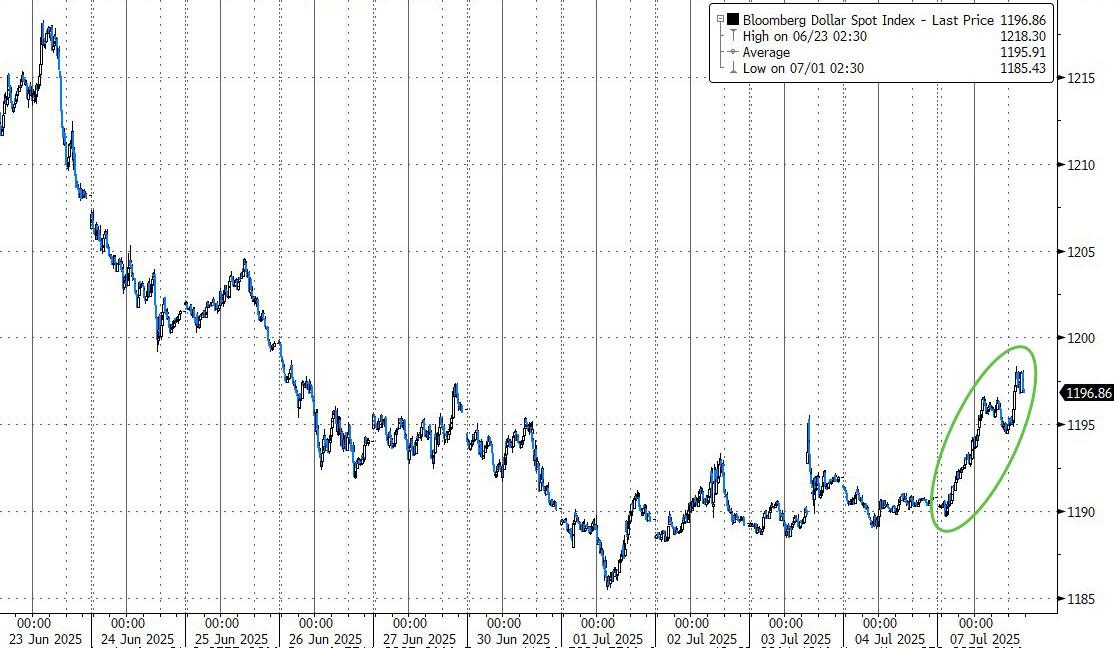
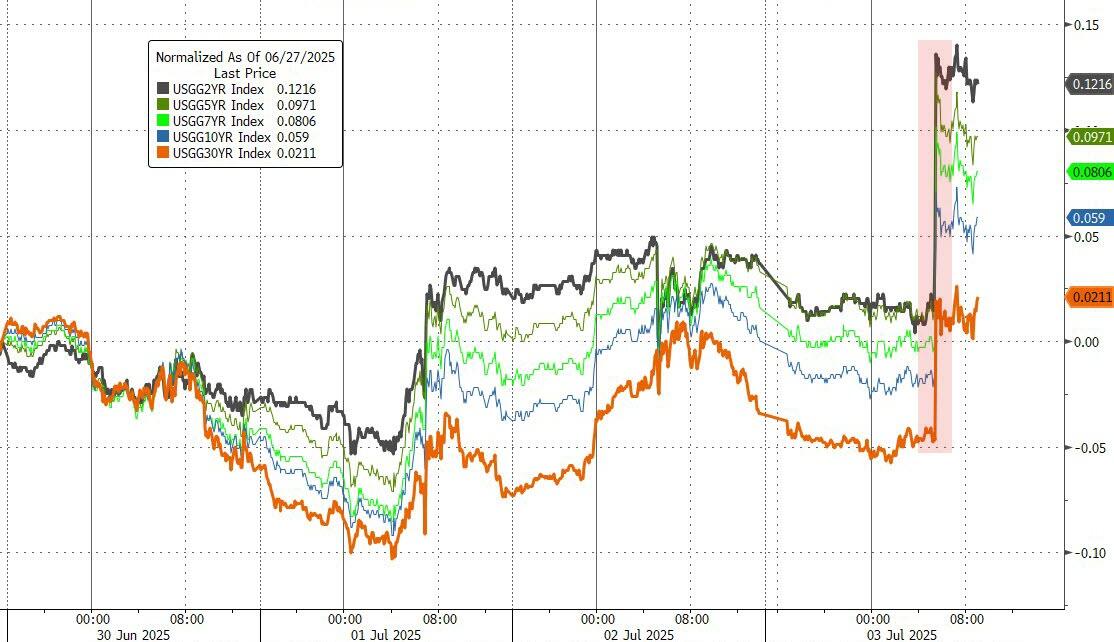
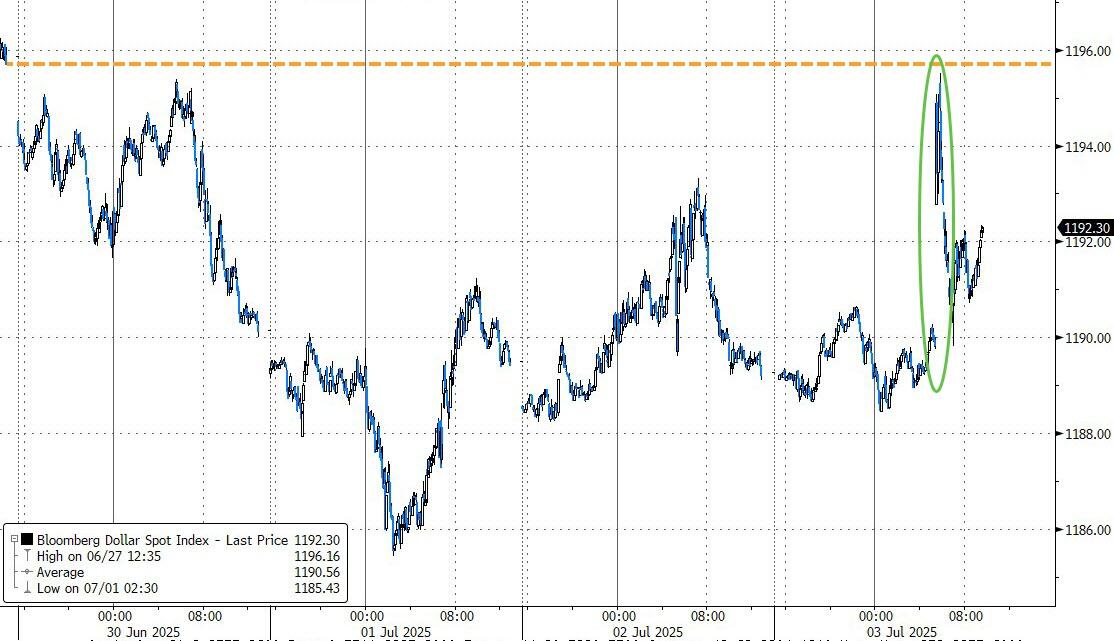
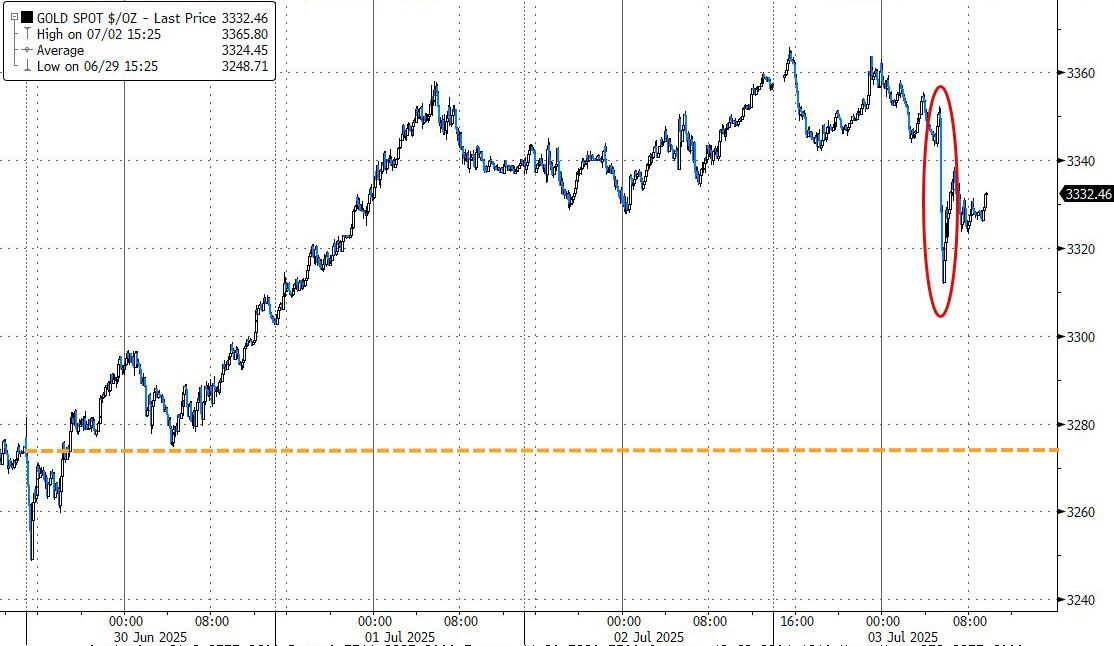
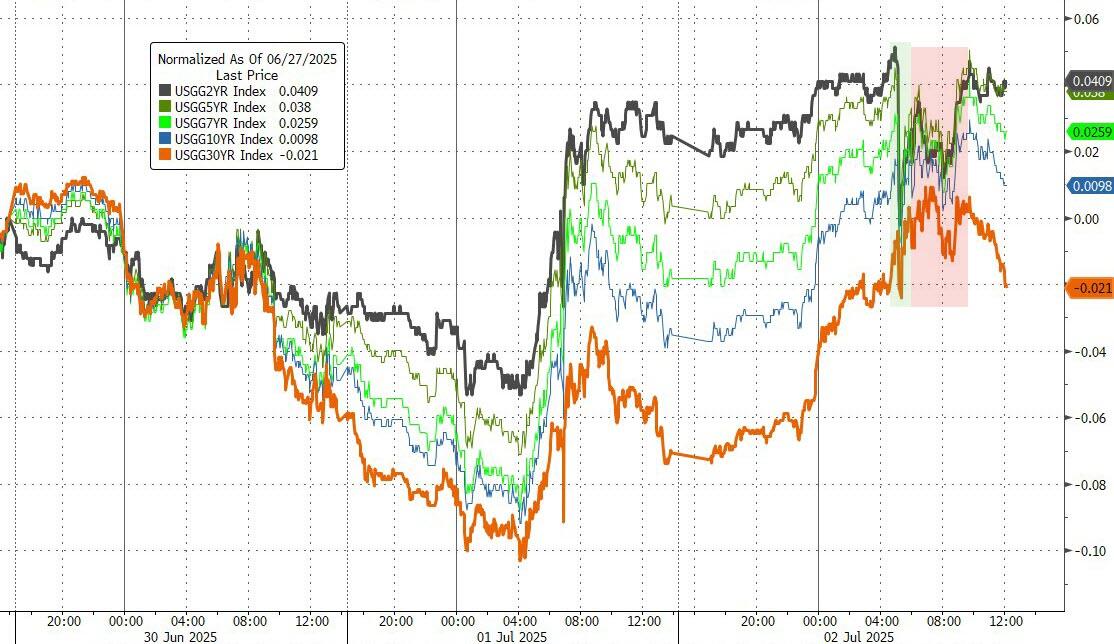
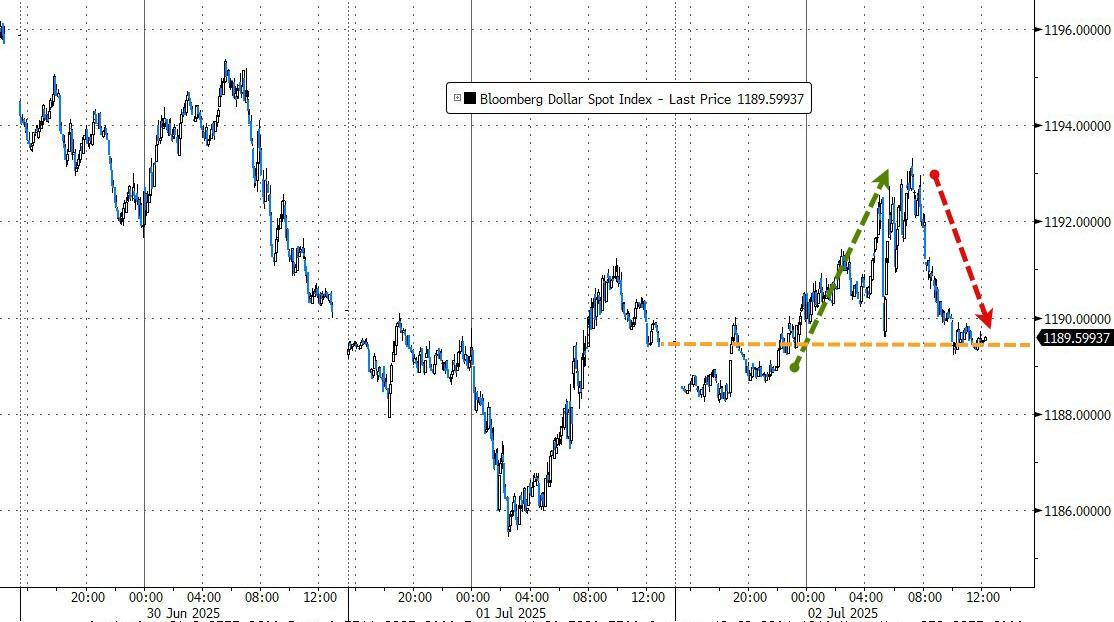
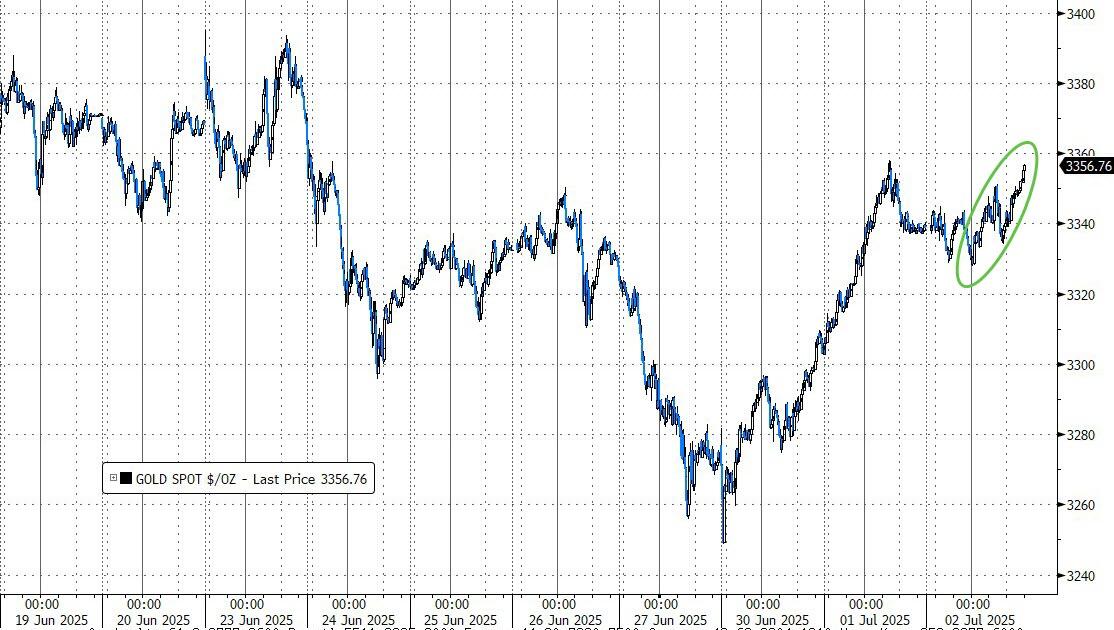
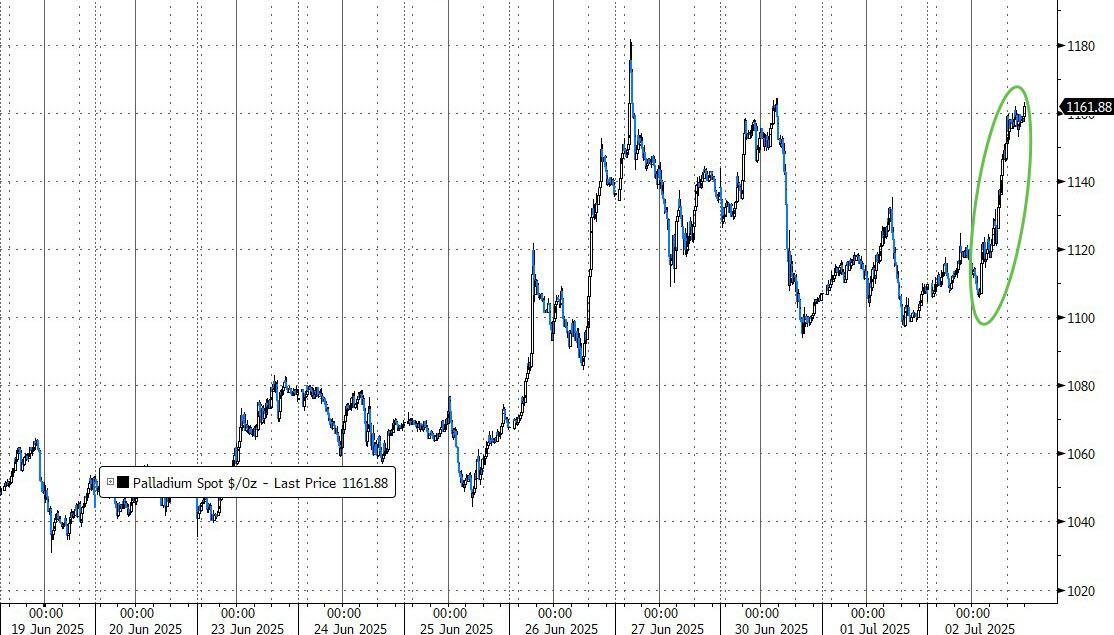
Elsewhere, the dollar stayed flat while bond yields slipped. Gold clawed its way back above $3,300 after briefly dipping below that level earlier.
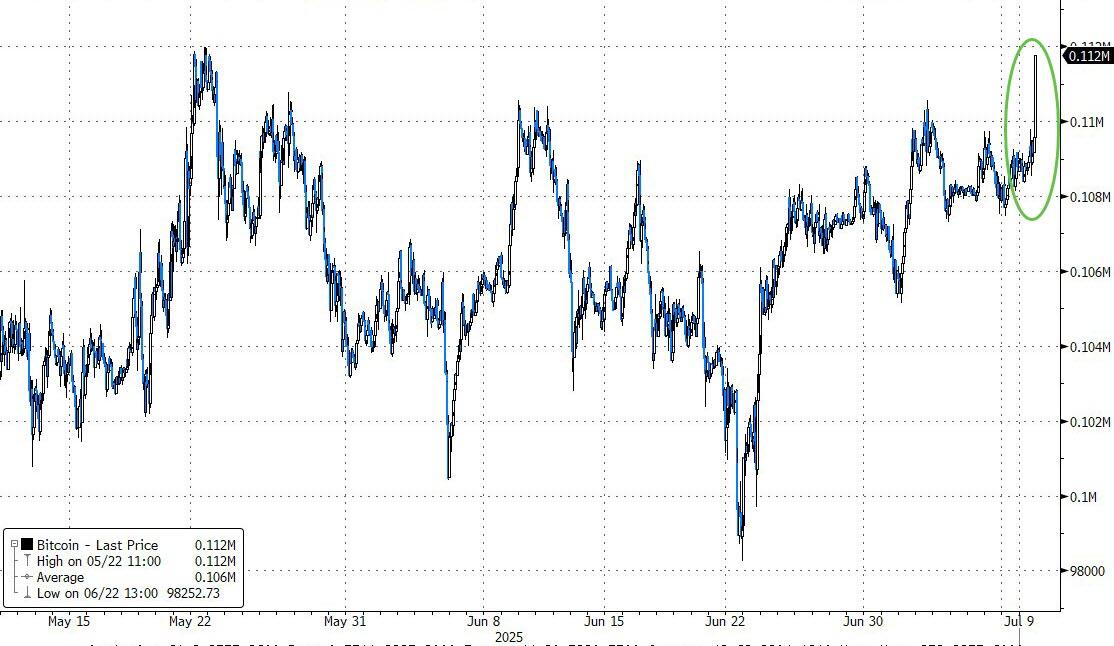
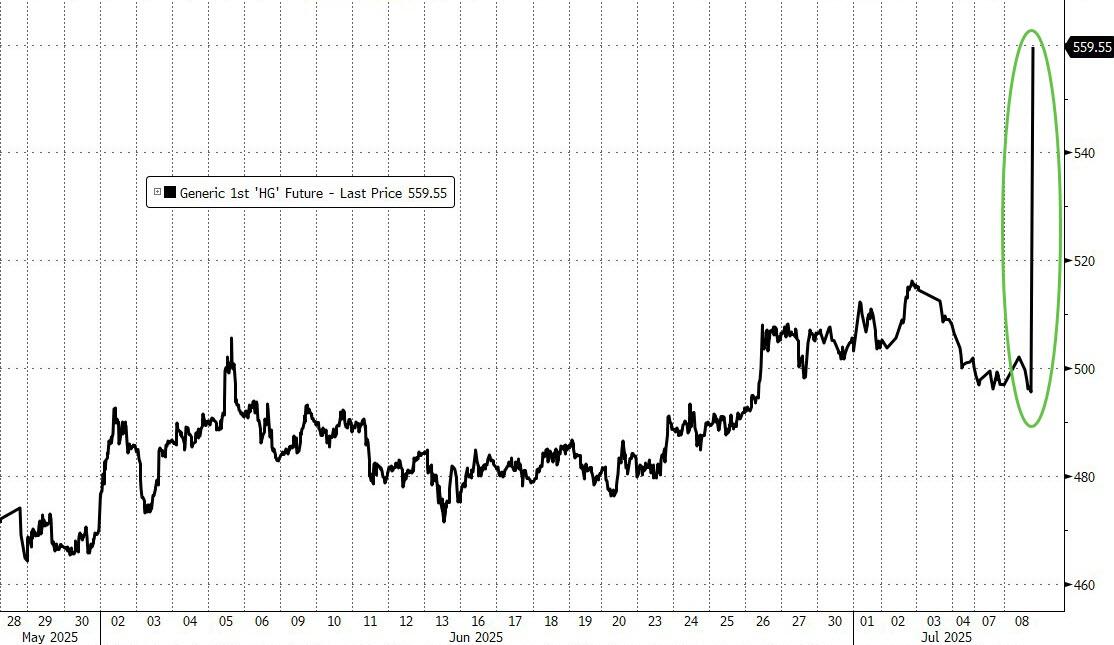
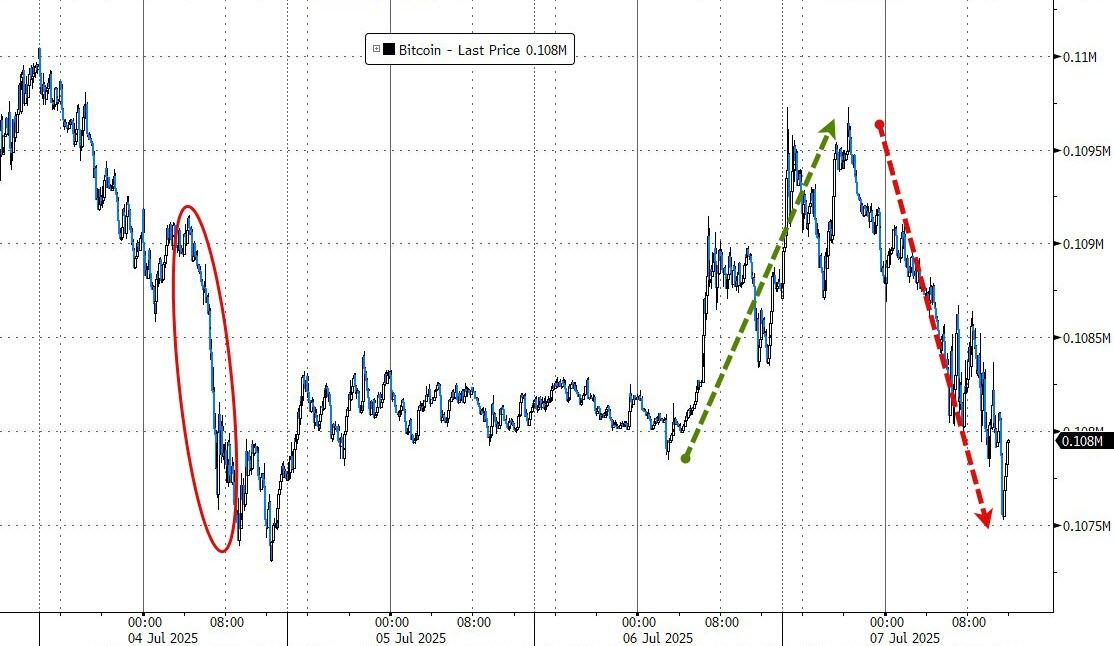
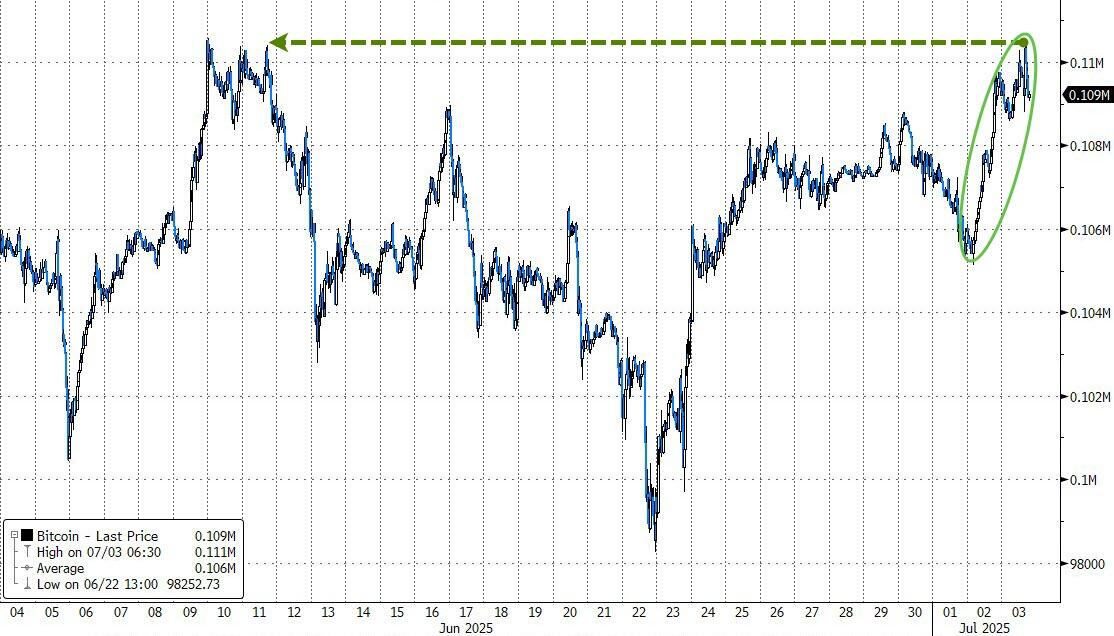
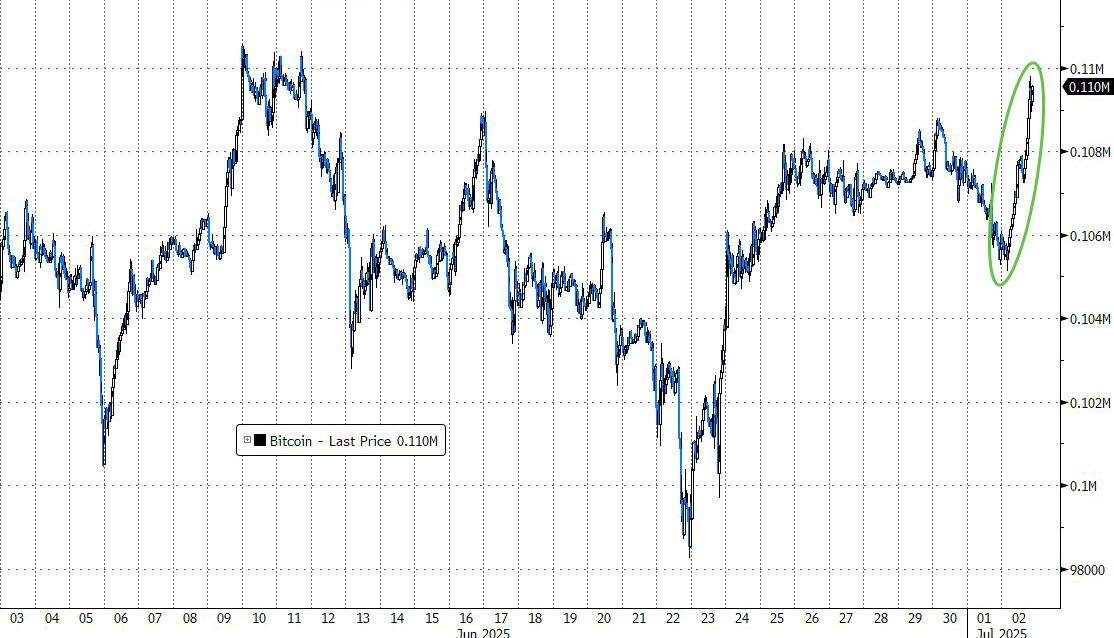
Copper had another solid session, up 1.6%, but Bitcoin stole the show—surging toward its all-time high of $112K and closing at its highest level ever at the end of U.S. market hours. (Of course, Bitcoin never really “closes.”)
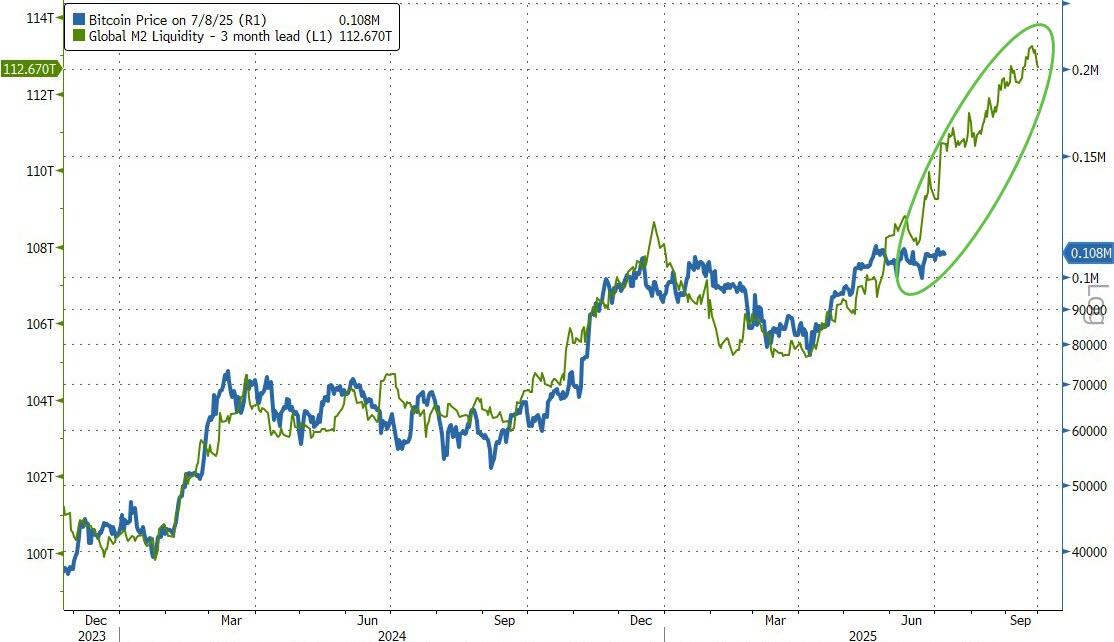
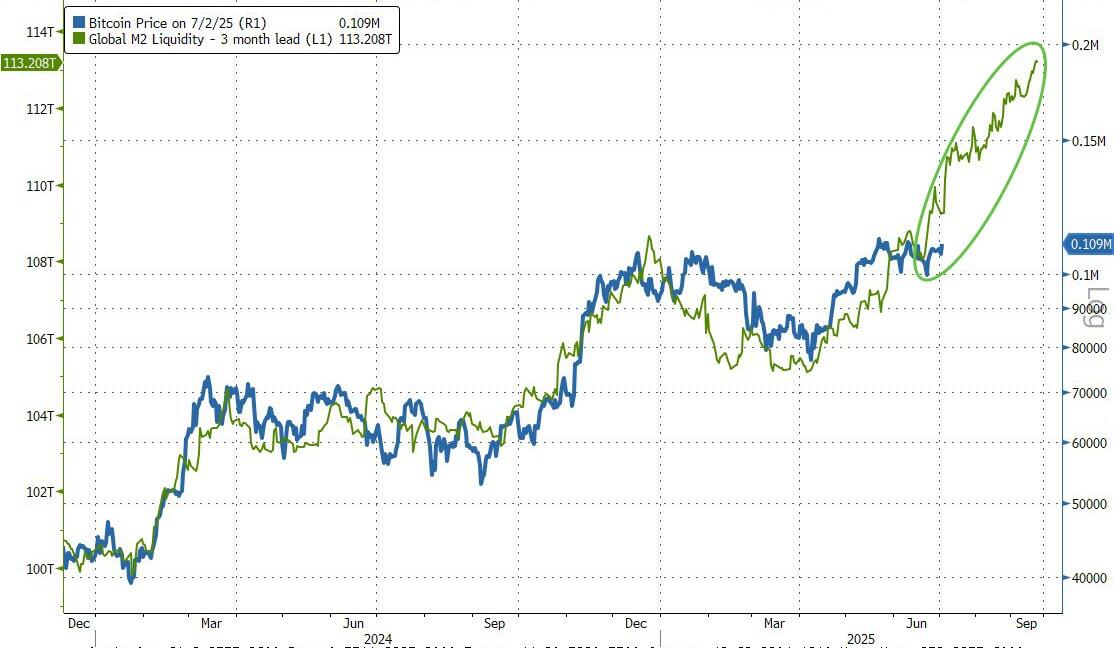
As I’ve said before, Bitcoin seems to be moving in lockstep with global liquidity trends—and this chart backs that up.
Read More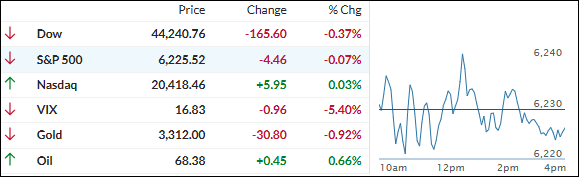