Do you want to know which ETFs are hot and which ones are not? Then you need my High-Volume ETF Cutline report. It tells you how close or far each of the 311 ETFs I follow is from its long-term trend line (39-week SMA). These are the ETFs that trade more than $5 million a day, so they are not some obscure funds that nobody cares about.
The report is split into two parts: The winners that are above their trend line (%M/A), and the losers that are below it. The yellow line is the line of shame that separates them. You can see how many ETFs are in each group and how they have changed since the last report (272 vs. 270 current).
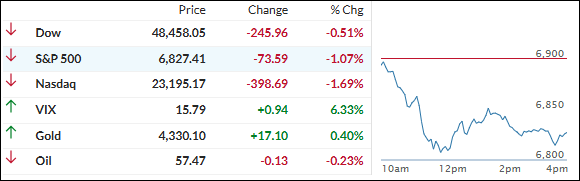
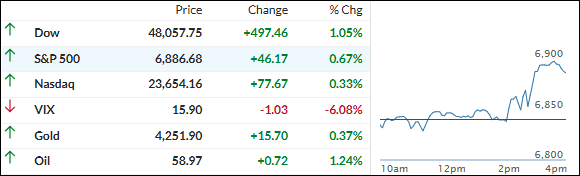
The Dow kicked things off by flashing a fresh record high—value and cyclicals were still getting love while everyone kept dumping tech.
But that early pop ran out of gas fast, and by mid-morning all three major indexes were sliding into the red, with the Nasdaq taking the biggest beating.
The main villain? Broadcom cratered 9% even after beating earnings and guiding AI chip sales to double**. That reignited the whole “when do we actually see ROI on this AI spending?” panic.
Palantir, Micron, and the usual suspects got dragged lower too. Meanwhile, financials, health care, and industrials quietly picked up some gains—classic rotation trade in full swing.
It was a wild, confusing week: dovish Fed + decent macro data on one side, AI profit-taking and valuation jitters on the other. End result? Nasdaq and S&P finished as the week’s big losers, while the Dow and small caps held up way better.
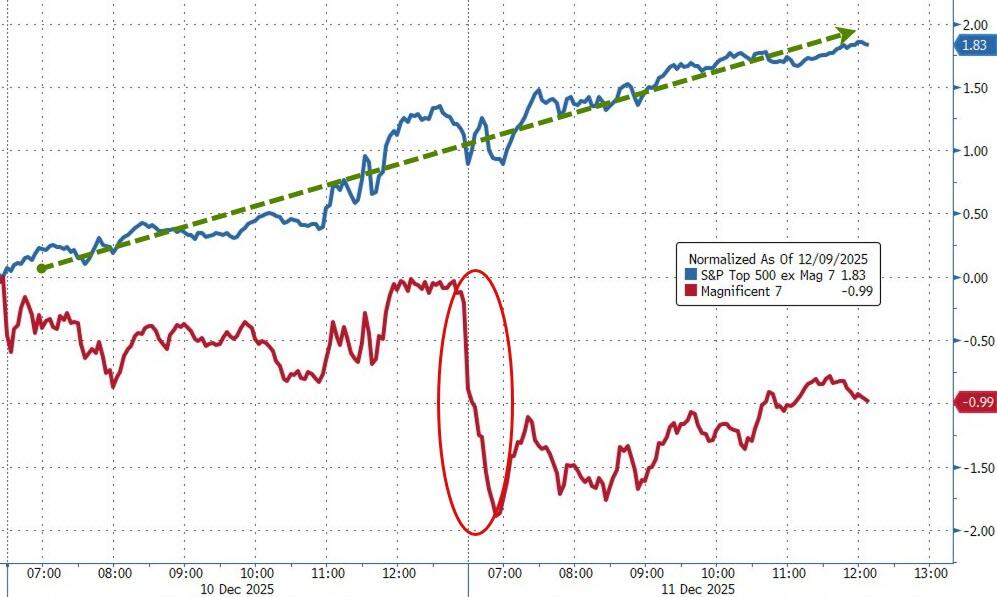
The Mag 7 got absolutely crushed mid-week onward, while the other 493 S&P names actually outperformed.
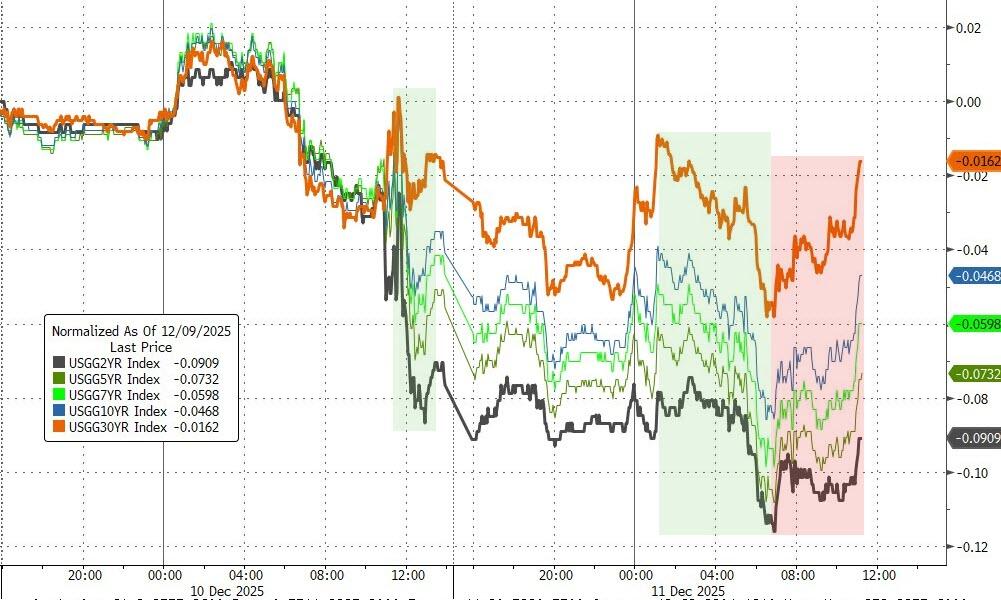
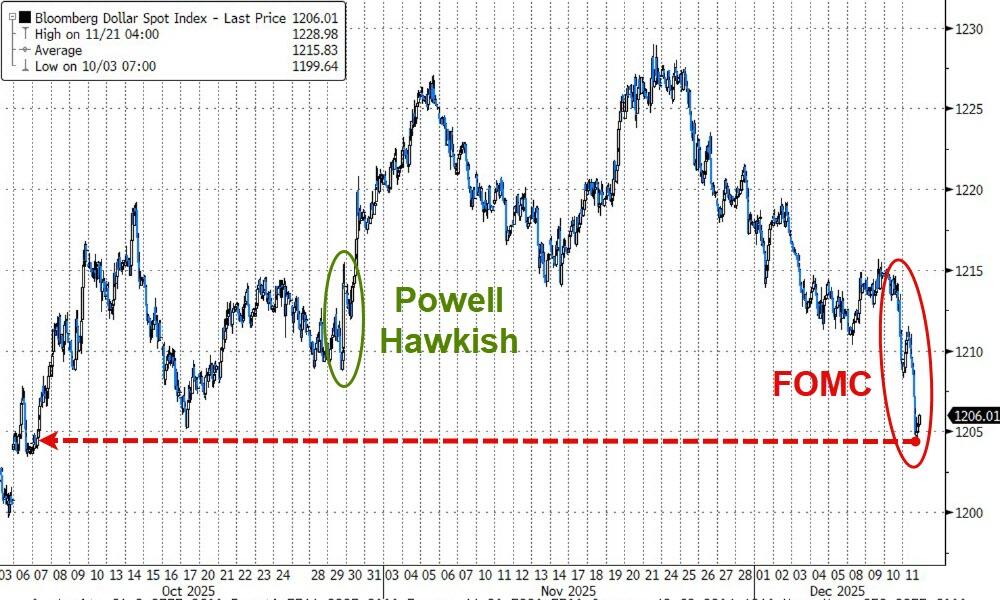
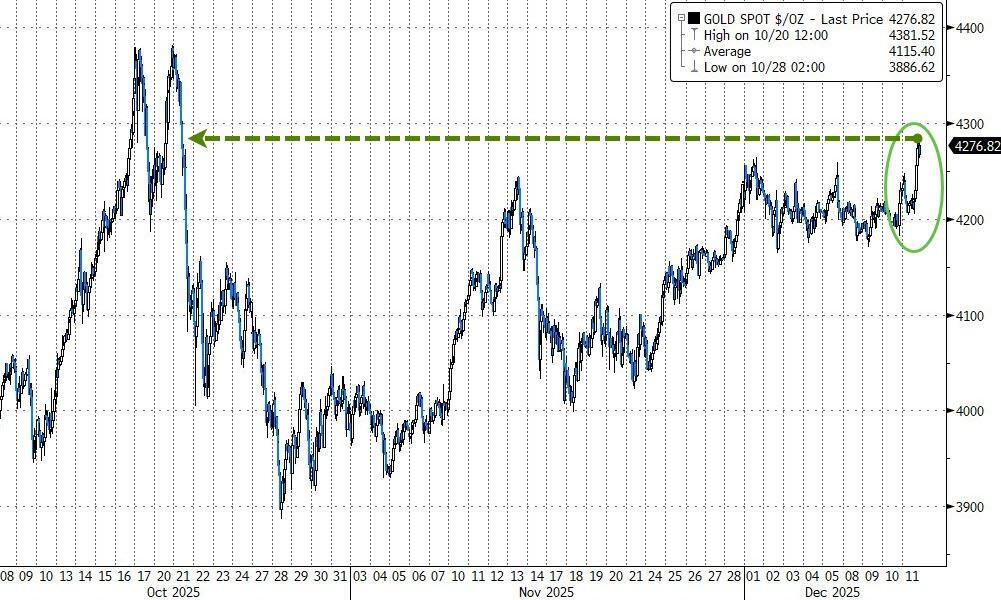
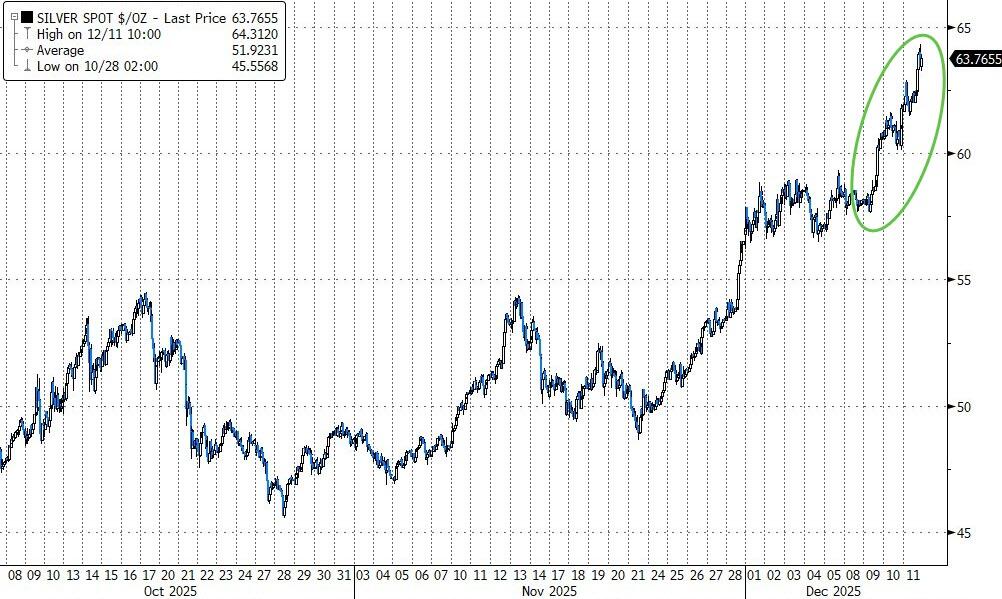
Bonds were mixed, the dollar hung near 3-month lows, but precious metals kept stealing the show—gold topped $4,300, silver kissed $65 intraday (another new record) before a little profit-taking hit.
Bitcoin? Pure rollercoaster but closed the week basically flat.
Quick question as we’re heading into the weekend: with tech getting punished but the broad market hanging tough and metals still on fire, does this feel like a healthy rotation that sets up a real year-end push… or the first little hairline crack in the 2025 bull story?
ETF Data updated through Thursday, December 11, 2025
How to use this StatSheet:
Out of the 1,800+ ETFs out there, I only pick the ones that trade over $5 million per day (HV ETFs), so you don’t get stuck with a lemon that nobody wants to buy or sell.
Trend Tracking Indexes (TTIs)
These are the main indicators that tell you when to buy or sell Domestic and International ETFs (section 1 and 2). They do that by comparing their position to their long-term M/A (Moving Average). If they cross above, and stay there, it’s a green light to buy. If they fall below, and keep going, it’s a red light to sell. And to make sure you don’t lose your shirt if things go south, I also use a 12% trailing stop loss on all positions in these categories.
All other investment areas don’t have a TTI and should be traded based on the position of each ETF relative to its own trend line (%M/A). That’s why I call them “Selective Buy.” In other words, if an ETF goes above its own trend line, you can buy it. But don’t forget to use a trailing sell stop of 12%, or less if you’re feeling nervous.
If some of these words sound like Greek to you, please check out the Glossary of Terms and new subscriber information in section 9.
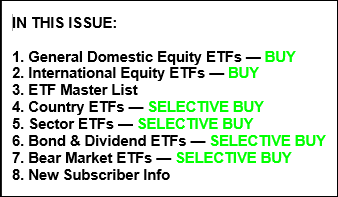
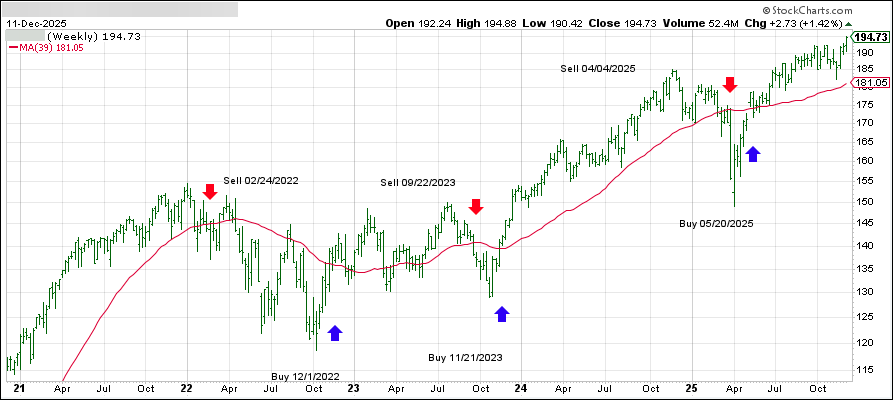
DOMESTIC EQUITY ETFs: BUY— effective 5/20/2025
Click on chart to enlarge
This is our main compass, the Domestic Trend Tracking Index (TTI-green line in the above chart). It has broken above its long-term trend line (red) by +7.93% and remains in “Buy” mode, with our holdings being subject to our trailing sell stops.
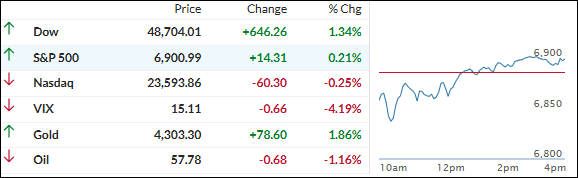
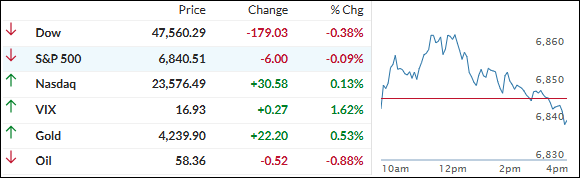
The market was split today: the Dow pushed to fresh highs, while the S&P 500 and Nasdaq slipped early on as renewed worries about pricey tech and AI plays took some air out of yesterday’s Fed-fueled optimism.
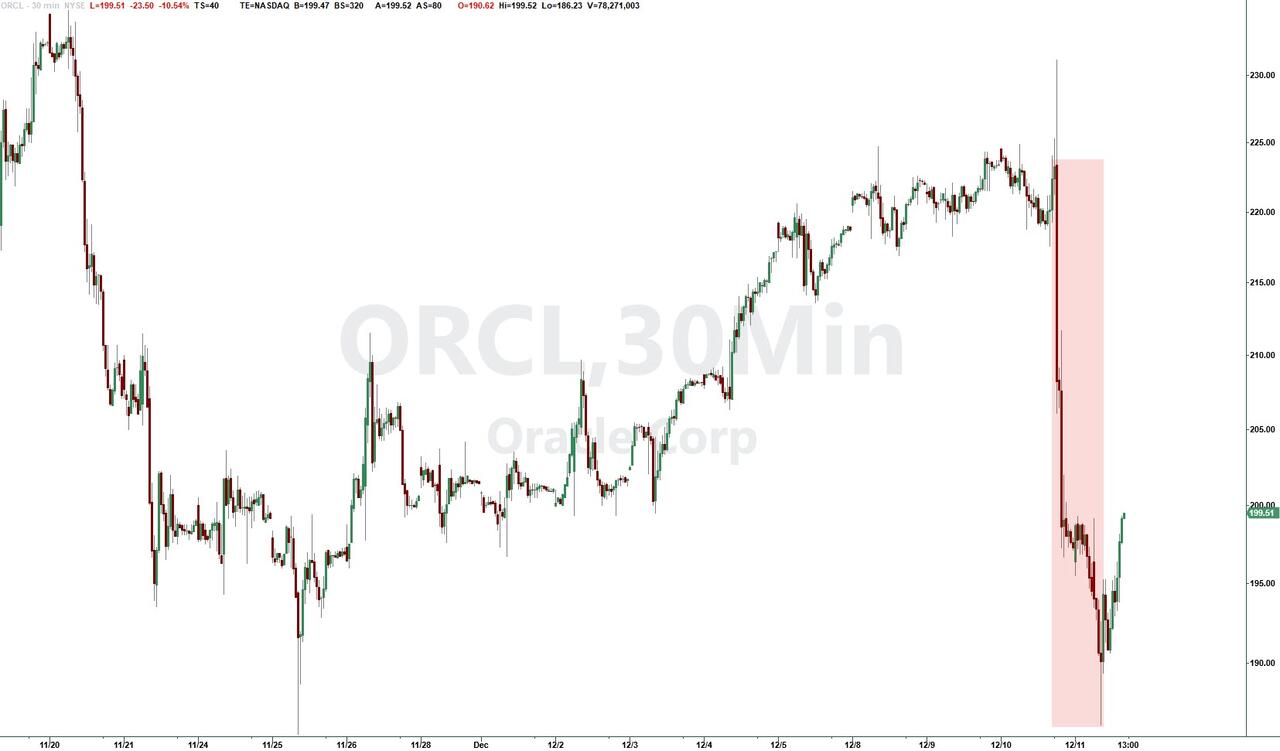
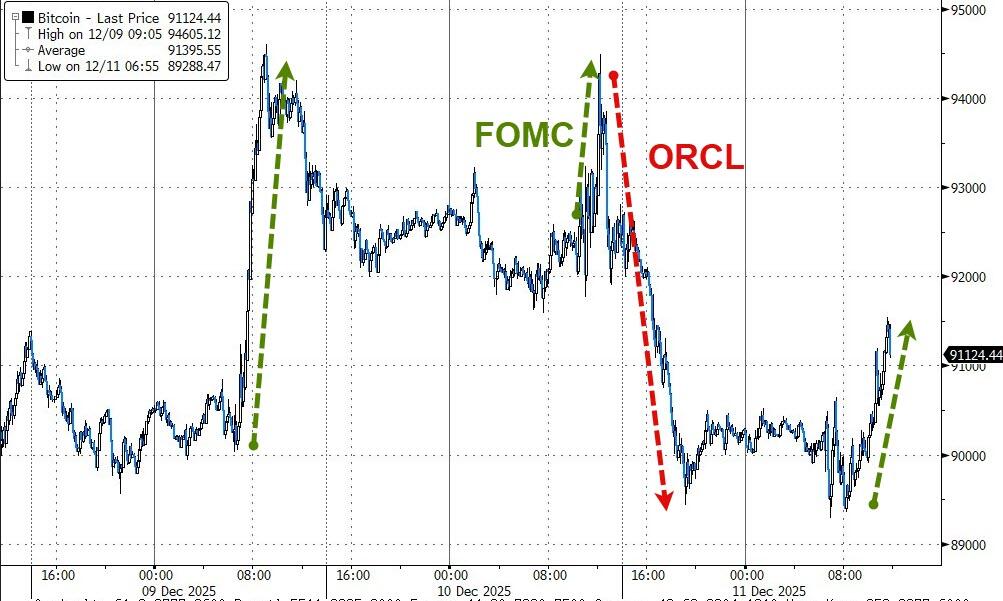
The rate cut glow from the prior session was still there, but Oracle’s numbers reminded traders that not every big AI story is translating cleanly into earnings just yet.
Oracle sank about 13% after missing on revenue and flagging higher spending, which also sharpened concerns about its growing debt load.
That disappointment spilled over into the broader AI space, with names like Nvidia, Broadcom, and AMD all trading lower and taking a bite out of the tech complex’s recent momentum.
Those moves hit right as the S&P 500 was flirting with new highs following the Fed’s third rate cut of the year and its decision to effectively take hikes off the table.
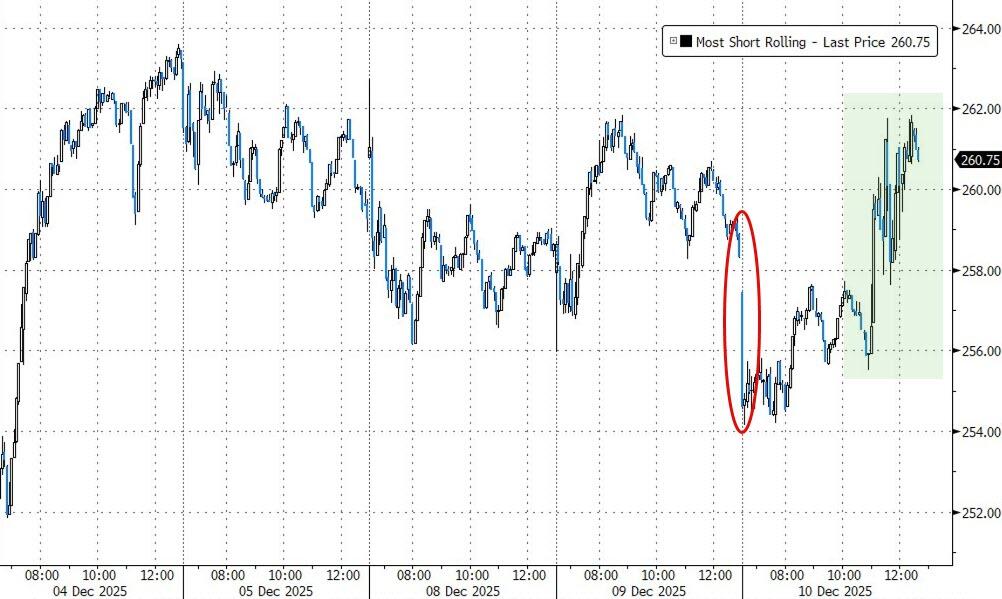
Small caps, tracked by the Russell 2000, remained a bright spot, as lower rates tend to benefit smaller, more rate‑sensitive companies, and they even managed a record close yesterday.
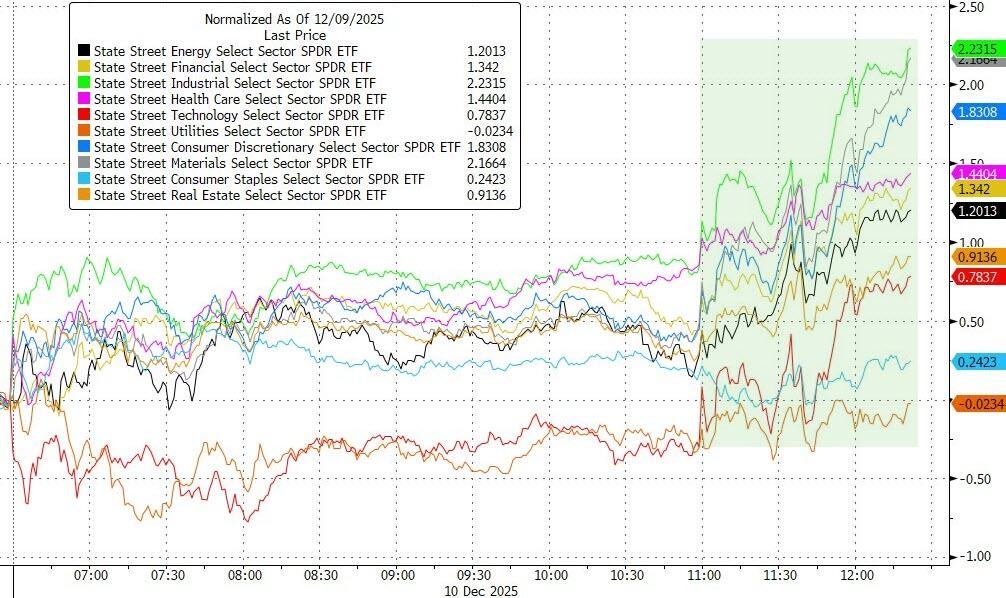
By the end of the day, every major sector except tech finished above the flat line, leaving the Mag 7 cohort trailing the other 493 S&P names by a wide margin.
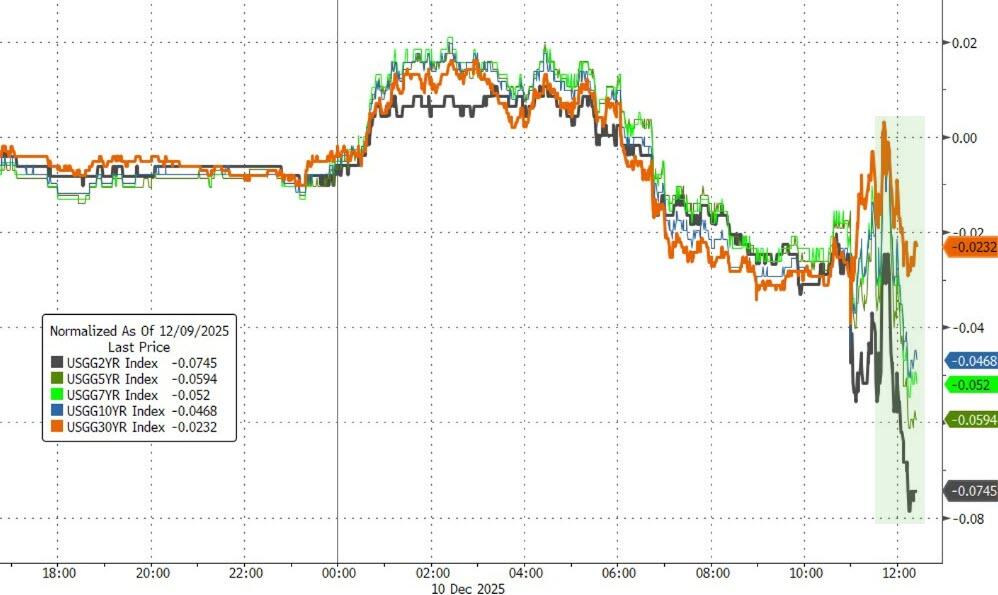
Bond yields were mixed, the dollar extended its slide, and hard assets stole the show: gold pushed above $4,300 and edged closer to record highs, silver punched through $64 intraday to notch yet another record as it continues to run ahead of gold, and copper quietly added about 1.6%.
Bitcoin chopped around with Oracle’s swings but still managed to finish above $91,000, underscoring how jumpy sentiment remains even after the Fed’s attempt to calm things with another cut and dovish messaging.
With tech wobbling, metals ripping, the dollar sliding, and crypto still volatile, the big question now is whether this tug‑of‑war ends in a healthy rotation beneath the surface—or if renewed AI and valuation worries end up derailing the broader rally into year‑end.
The market spent most of the morning just shuffling around the flat line as everyone waited for the Fed, but things changed quickly once the decision hit.
By the close, stocks were solidly higher, with gains broadening out across almost every corner of the market.
The Fed did exactly what traders were hoping for, cutting rates by another 0.25%—its third straight reduction—and Chair Powell avoided saying anything that might kill the mood.
While there was some pushback inside the committee, his tone stayed comfortably dovish, which was all the market needed to hear.
After treading water early on, the major indexes flipped into rally mode, helped along by a late-day short squeeze that lifted nearly every sector into the green.
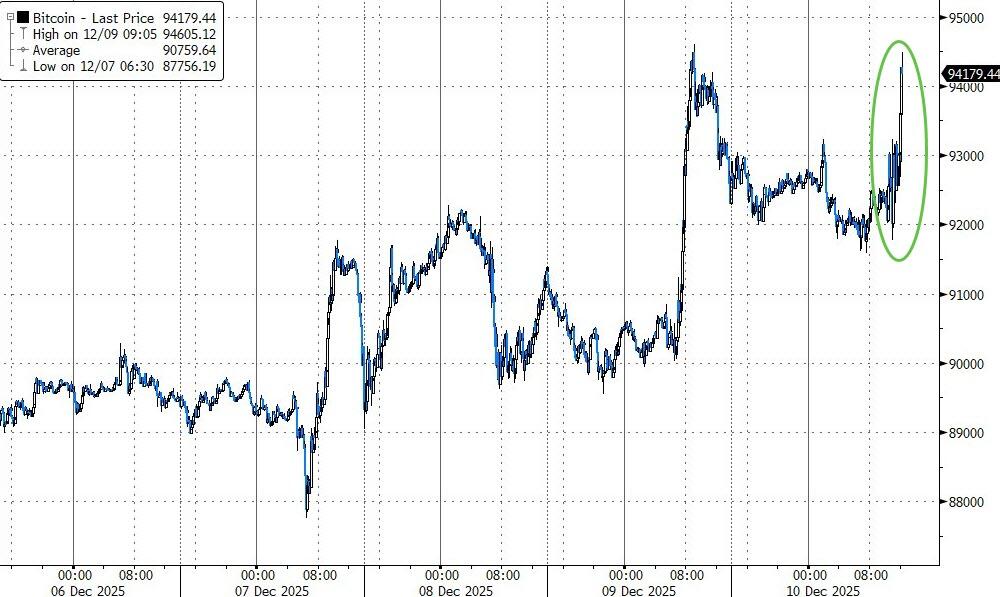
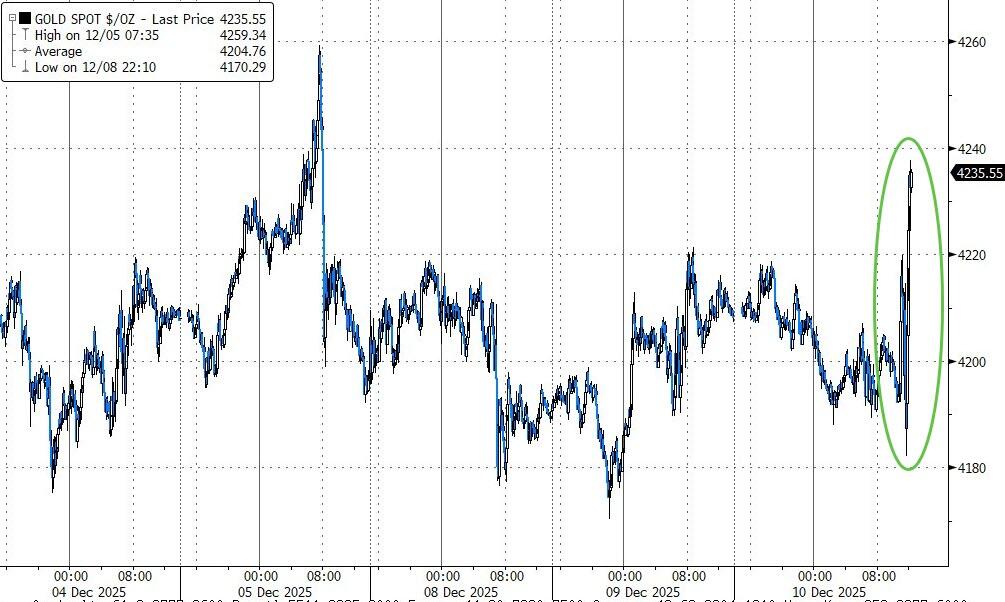
Bond yields slipped, and the “risk-on plus hedges” trade showed up in full force: Bitcoin jumped back above $94,000, gold pushed through $4,250, and silver briefly ripped above $62 before easing just under that mark into the close.
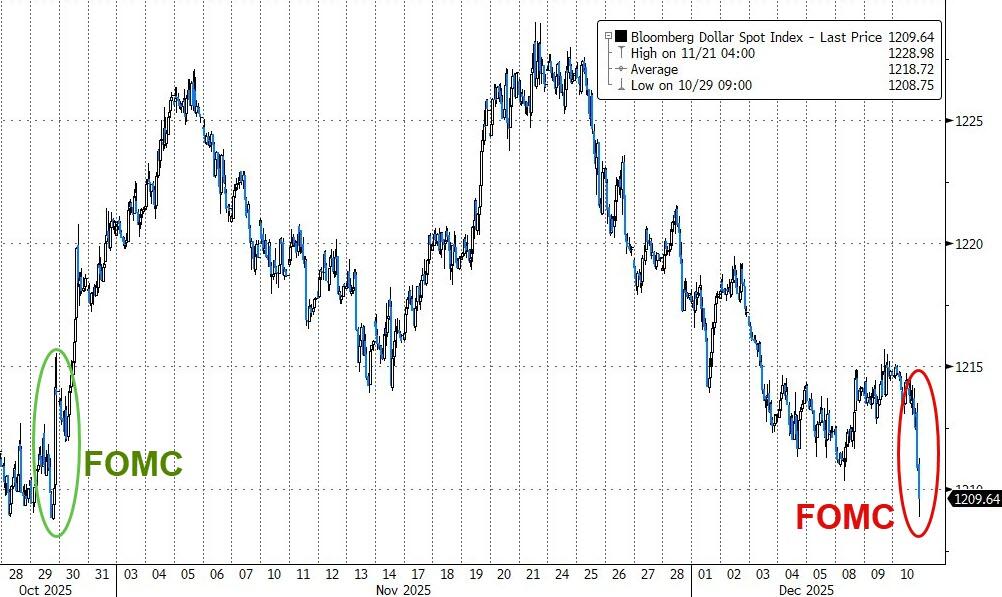
As expected, the dollar weakened and ended the day right back where it was at the time of the prior FOMC meeting, underscoring how much the focus has shifted toward easier policy and looser financial conditions.
With the long-anticipated rate cut now delivered and the Fed sounding more helpful than harmful, the big question is whether this sets the stage for the classic Santa Claus rally—or if lingering growth and inflation worries will cap the upside into year-end.
The major indexes didn’t go far today, drifting around the flat line as Wall Street shifted into full wait-and-see mode ahead of tomorrow’s Fed decision.
With this being the last policy meeting of the year, traders were more interested in what’s coming than in making big moves intraday.
Right now, markets are heavily leaning toward another quarter‑point rate cut, matching what the Fed delivered in September and October, with odds up to roughly the high‑80% range versus the mid‑60s about a month ago.
A cut may feel almost baked in, but the real market driver will be the updated economic projections and what Chair Powell says about growth, inflation, and how much easing is left in the tank.
Given the recent pullback in stocks and crypto, risk‑on traders are clearly hoping the Fed will grease the skids for a year‑end rally instead of cooling the tape with cautious talk.
At the same time, policymakers are juggling sticky inflation, murky macro signals, missing or delayed data from the long government shutdown, and the broader uncertainty around Fed leadership as 2026 approaches.
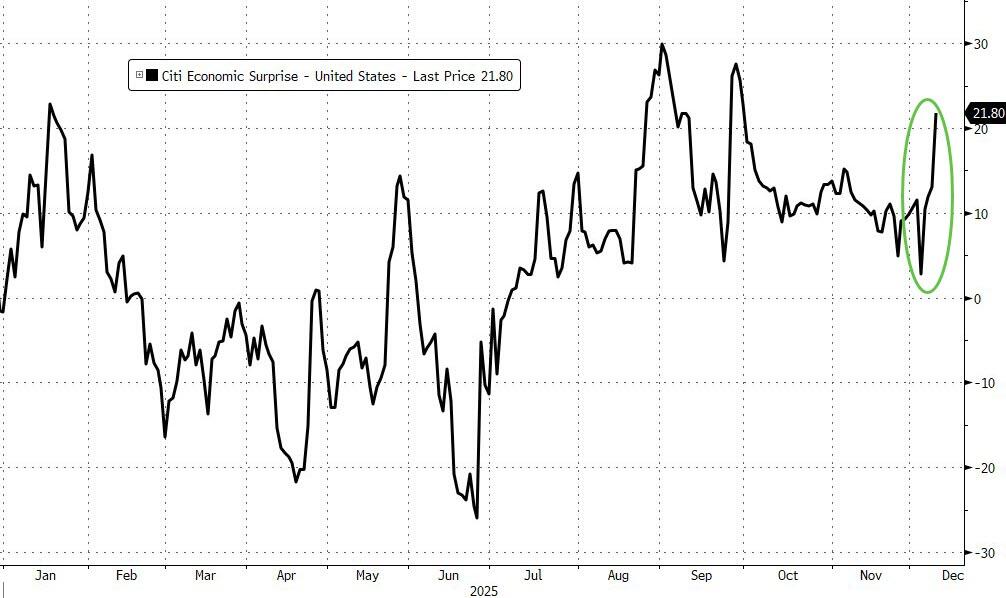
By the close, the major indexes mostly churned sideways, with only the Nasdaq managing a small gain. Economic reports were a mixed bag, even as the Citi Economic Surprise Index ticked higher, hinting that data has lately been coming in a bit better than forecasts.
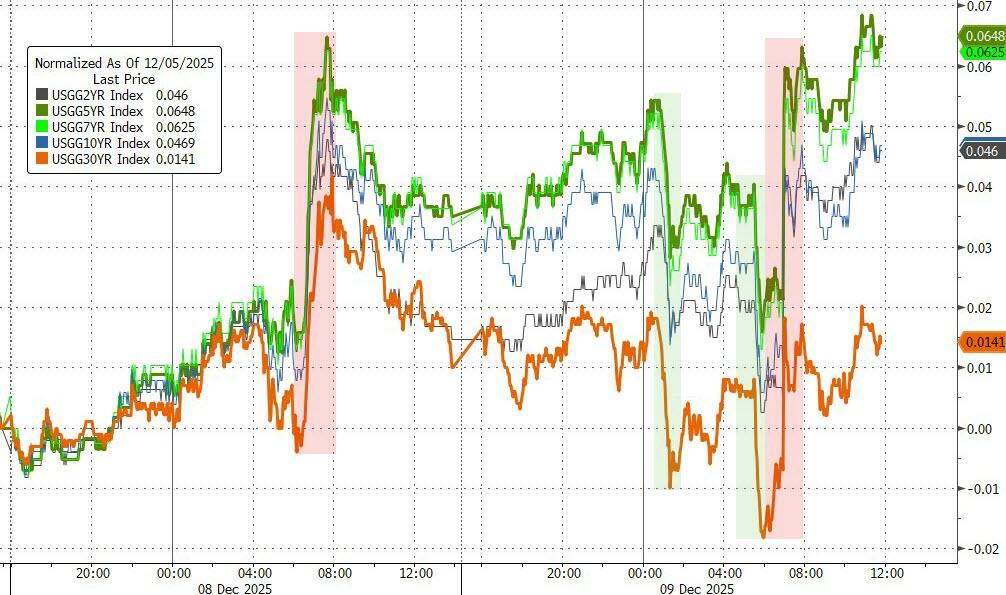
Under the surface, bond yields pushed higher again, but the real fireworks were in precious metals and Bitcoin.
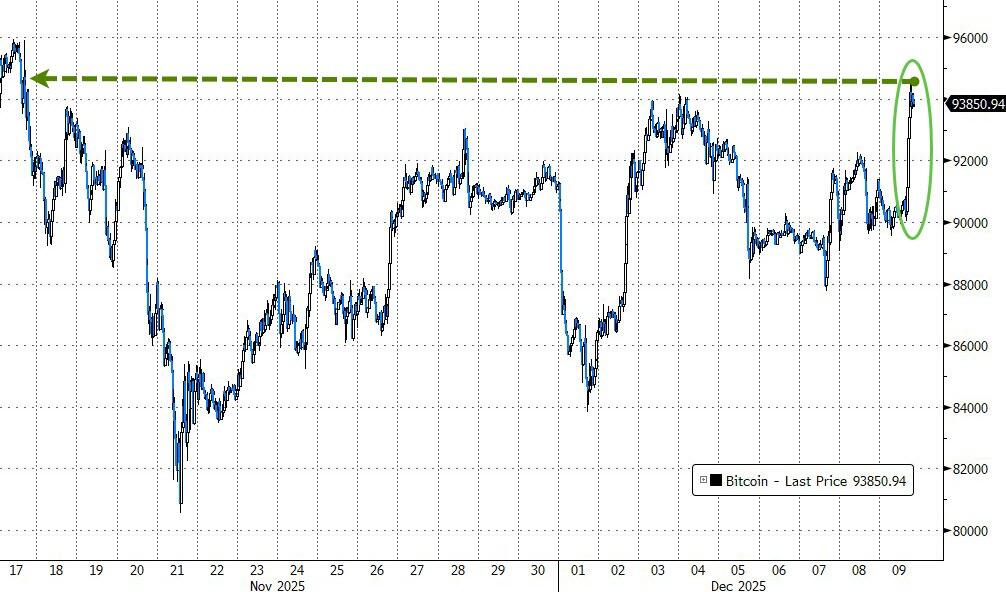
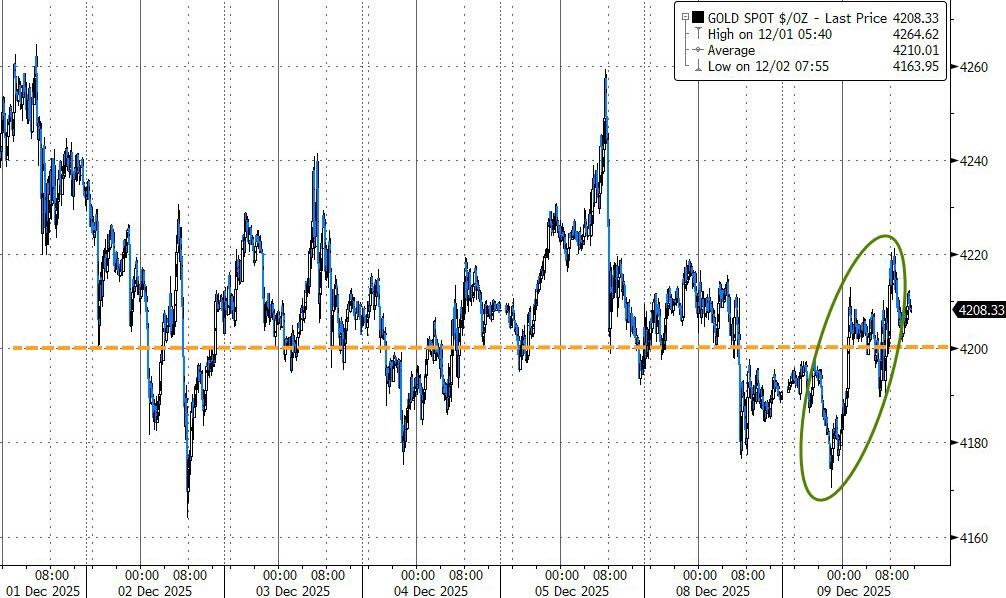
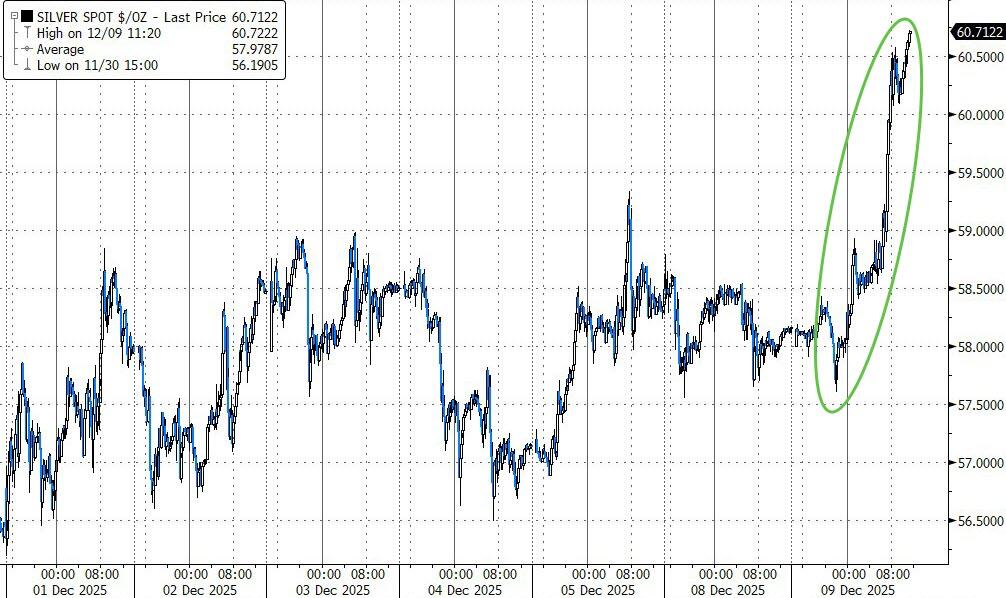
Bitcoin ripped back toward four‑week highs near 94k, gold added modestly while holding comfortably above 4,200, and silver stole the spotlight with a 4.7% jump to break through the 60 level for the first time ever—a fresh record and another sign of how aggressively money has been rotating into metals.
With so many cross‑currents—from inflation and growth worries to delayed data, leadership questions, and a market still leaning heavily on the promise of easier policy—the big question now is whether the Fed can deliver a dovish-enough message to keep this fragile risk‑on tone alive into 2026, or whether its dual mandate will force a more cautious stance that reins in the doves.
